


Ethereum price continues to weaken as long-term holders sell at their fastest pace since 2021, putting steady pressure on ETH market sentiment.
Summary
- Ethereum price is sliding as long-term holders increase daily sell pressure
- Futures data from CryptoQuant shows net taker volume is still negative, suggesting buyers have not regained control.
- Technical indicators and moving averages remain aligned to the downside, maintaining bearish trend.
Ethereum is trading near $3,211, down 10% in the past 24 hours. The price has fallen 4% over the week and 21% in the past month, leaving it about 35% below the August high of $4,946. Trading volume rose 32.7% to $49.6 billion, showing more activity as prices drop.
Derivatives activity increased, with volume up 27.6% to $139.7 billion, while open interest fell about 7% to $37.8 billion. This mix often means that traders are closing positions during the decline instead of building new leverage.
Long-term ETH holders step up selling
According to a Nov. 14 post on X by Glassnode, long-term Ethereum (ETH) holders have increased their selling activity over the past three months. Addresses holding ETH for 3 to 10 years have been moving or selling over 45,000 ETH per day on average, based on the 90-day trend. This is the highest level of spending from this group since Feb. 2021.
When long-term holders sell at this rate, it usually happens when they decide to lock in profits or limit their exposure following large rallies. This could mean that ETH may need more time to steady before buyers step in again with confidence.
CryptoQuant analysts also note that Ethereum’s Net Taker Volume (30-day MA) is still negative. Selling pressure in the futures market has eased compared to September, but sellers are still stronger than buyers.
In past market cycles, ETH tended to find a firm bottom only after this metric turned positive. Until that happens, the market may go through more sideways or downward movement before forming a clear base.
Ethereum price technical analysis
Ethereum is trading close to the lower Bollinger Band on the daily chart, indicating that the market is still under pressure. All of the major moving averages, from the 10-day to the 200-day, are below the price, which maintains the downward trend.
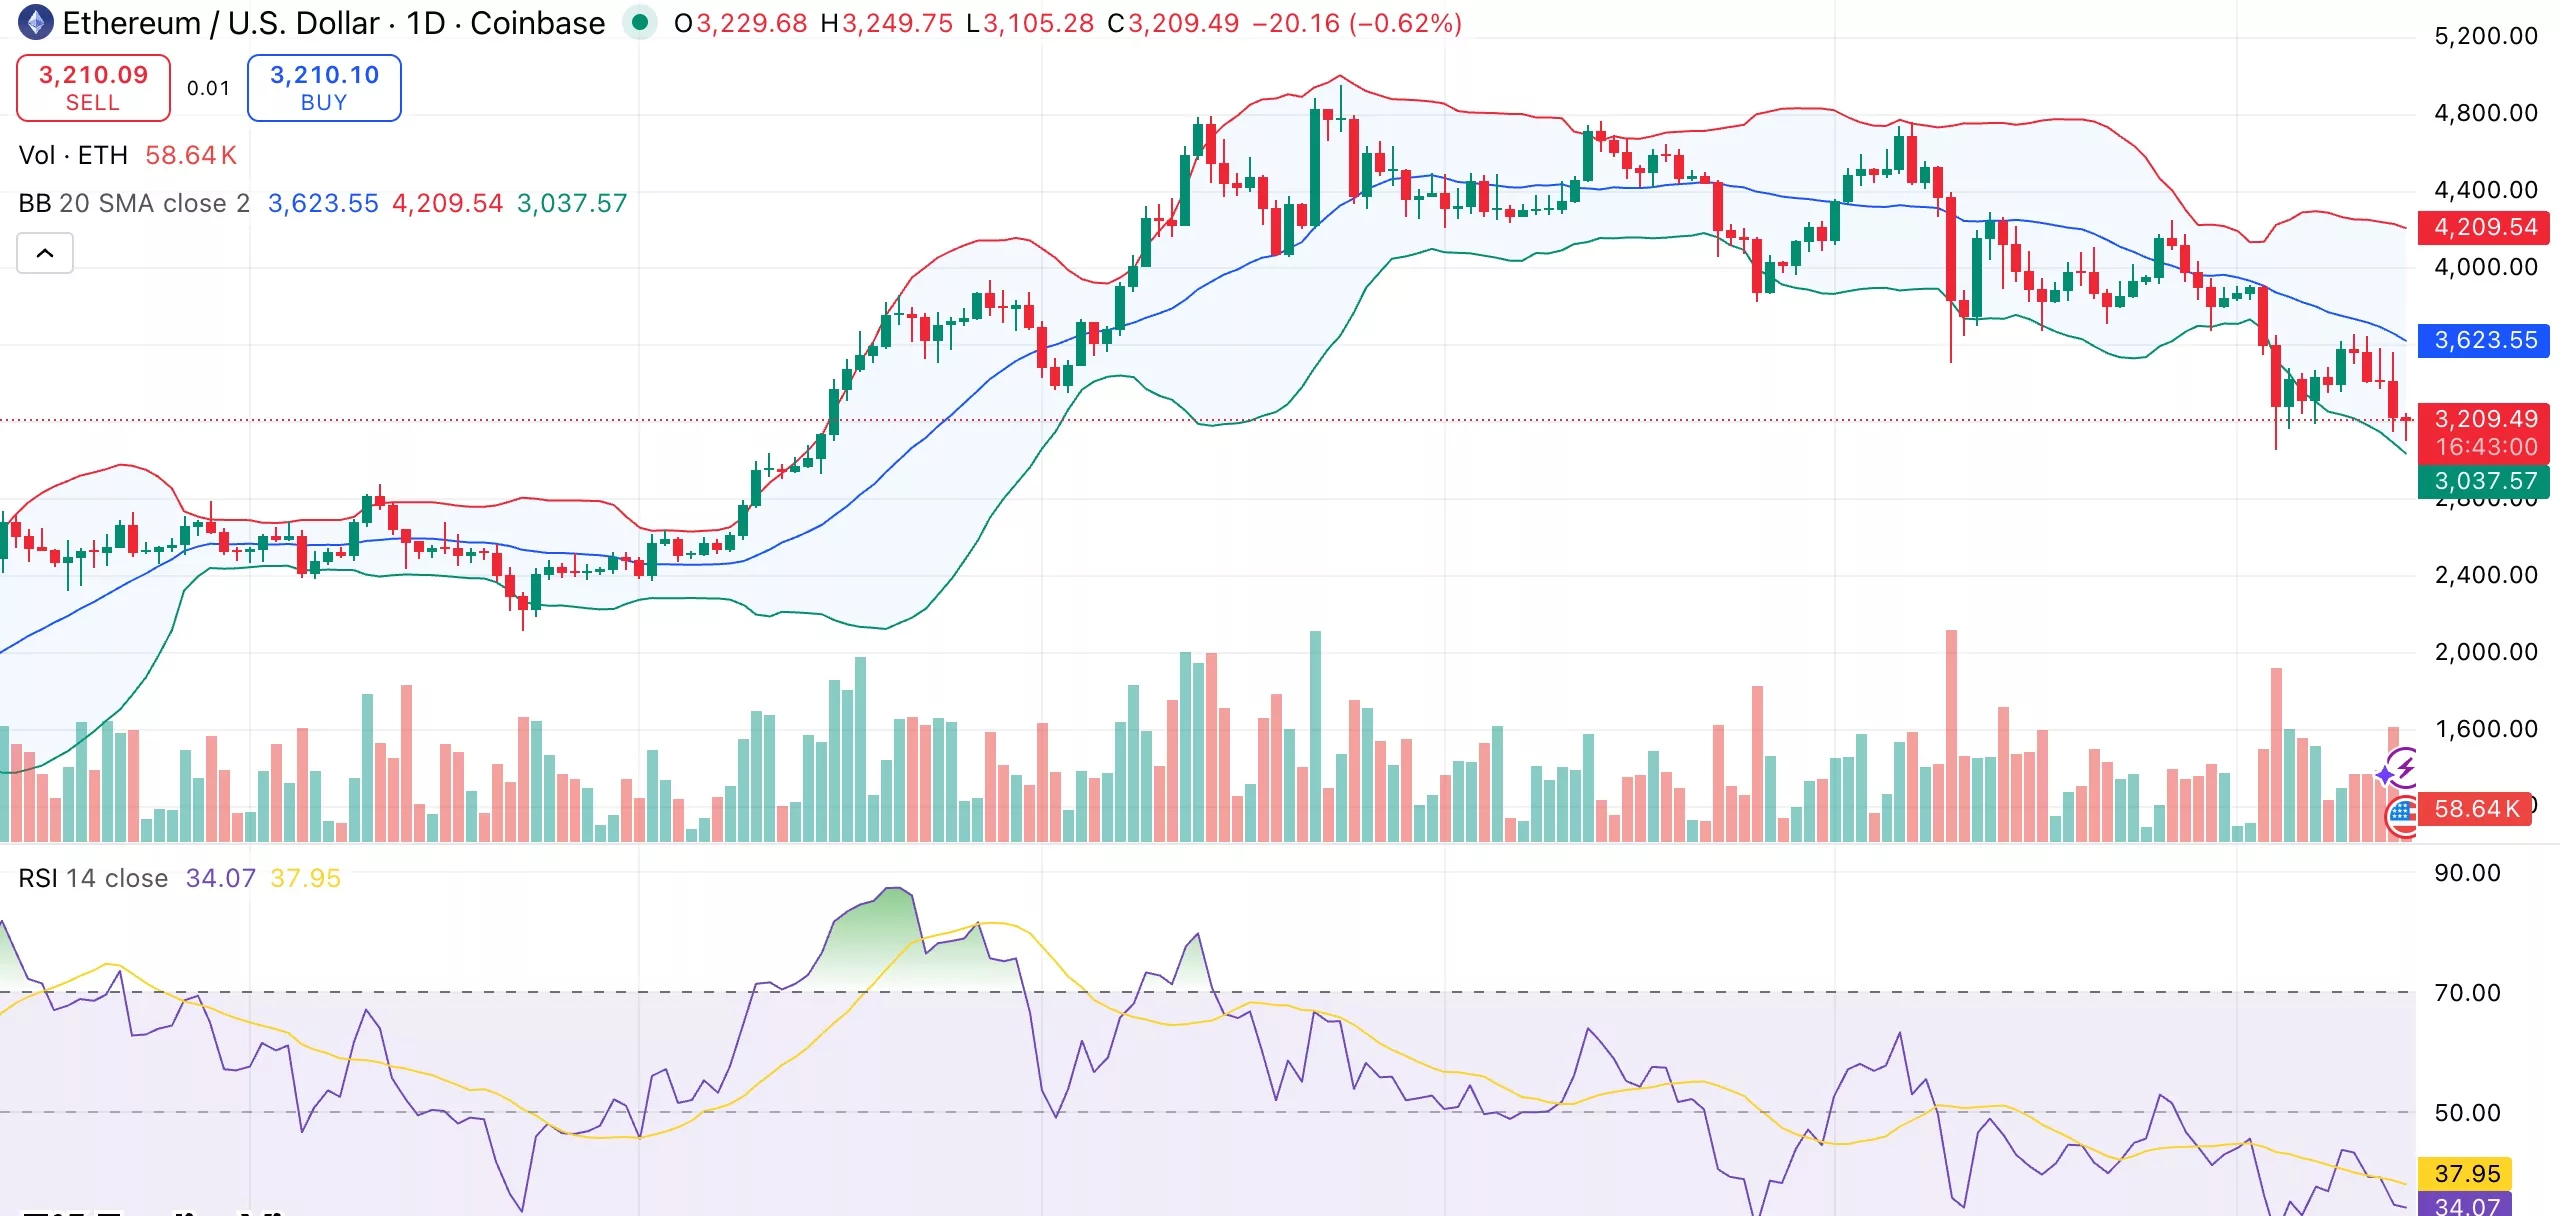
Although the relative strength index, which is at 34, is not yet in deep oversold territory, it is displaying weak momentum. The MACD is negative as well, as are other short-term indicators.
ETH would need to reclaim the $3,350–$3,400 range, which has served as resistance, to gain traction. The next levels to keep an eye on are $2,850 and $2,700 if it is unable to maintain above $3,000.