


The crypto market rally continued on January 28 as investors awaited the Federal Reserve’s interest rate decision.
Summary
- The crypto market rally could be at risk of unraveling as geopolitical risks rise.
- Donald Trump warned Iran of an attack as a large armada arrived in the Middle East
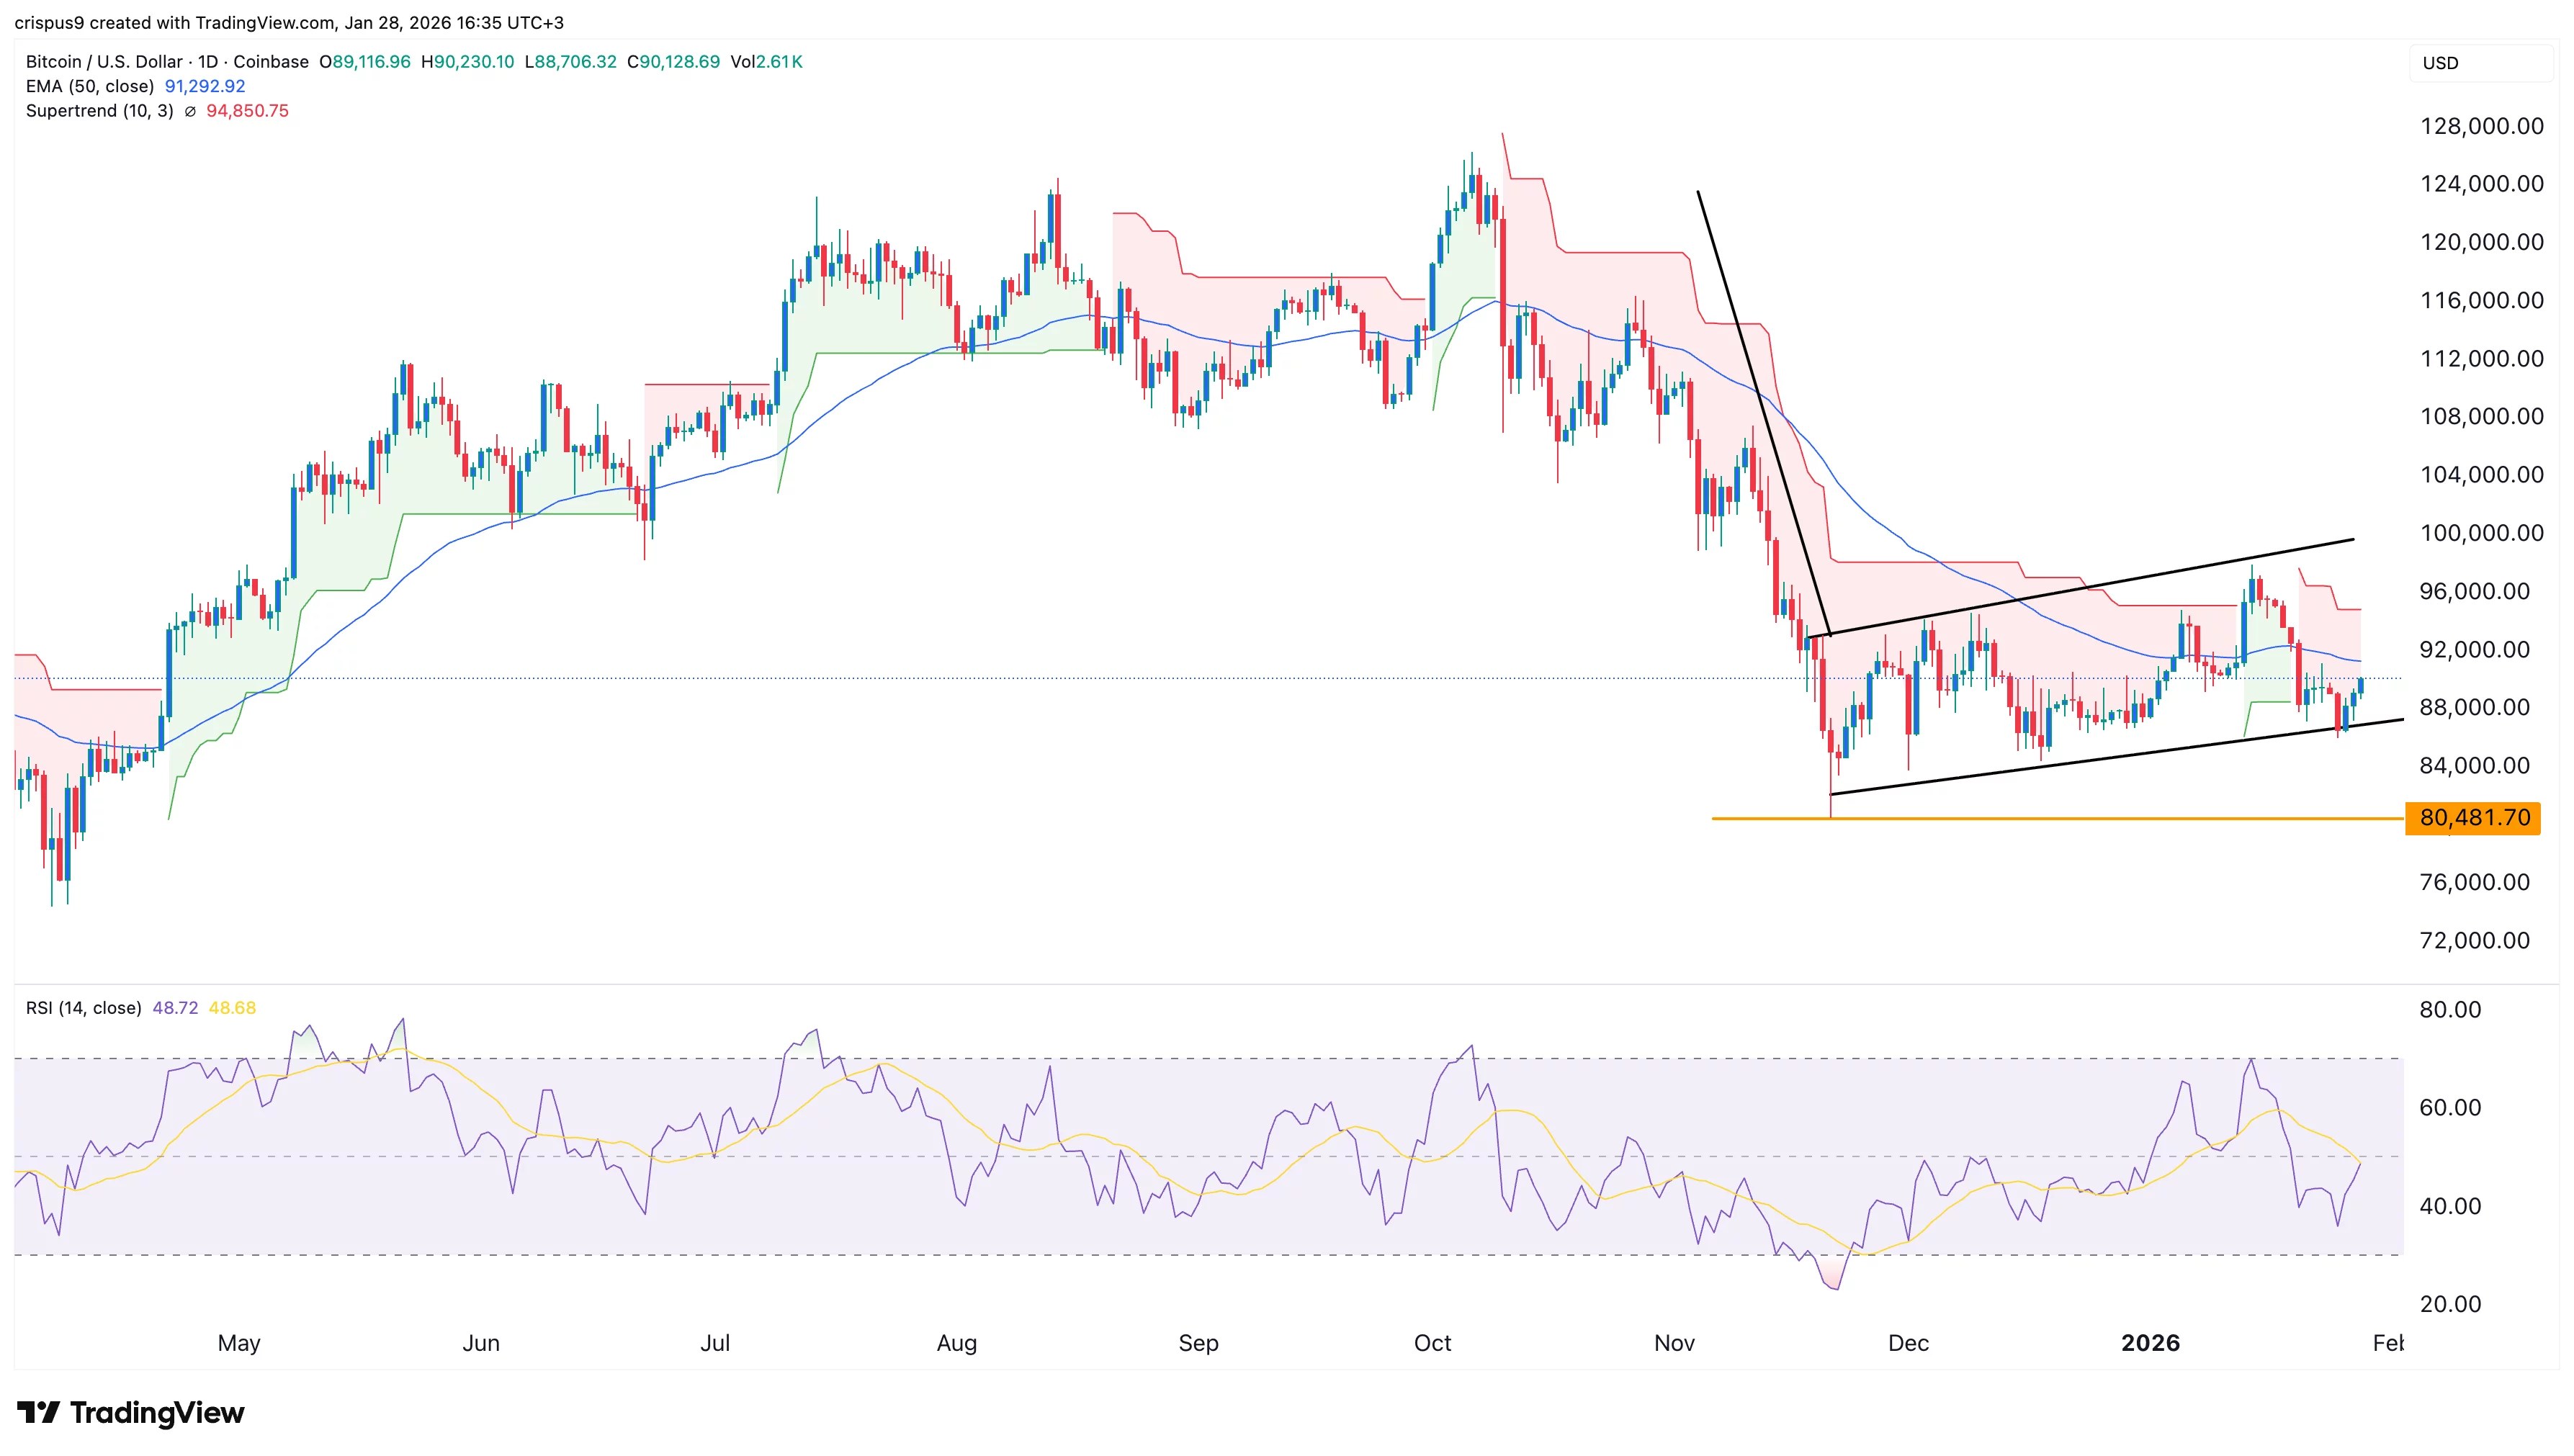
- Bitcoin has formed a bearish flag pattern, pointing to a bearish breakout.
Bitcoin (BTC) crossed the important $90,000 resistance level, while the market capitalization of all tokens jumped to over $3.03 trillion.
The top gainers in the crypto market included tokens such as Pippin, Hyperliquid, Canton, Jupiter, and Quant. Pippin token jumped by over 67%, while Hyperliquid soared for the third consecutive day, reaching a high of $34.28, its highest level since November.
Crypto market rally at risk as Trump warns Iran
The ongoing cryptocurrency market rally could be at risk after Donald Trump warned Iran of a potential attack as a large armada arrived in the Middle East.
Trump called on the regime to negotiate, saying that time was running out. He wants a deal that will see the country abandon its nuclear weapons program.
This statement came as data on Polymarket showed that most traders were betting that Trump would attack Iran before the end of the year. Odds of an attack before the year ends rose to 75%, while those of March 31 rose to 60%.
An attack on Iran would be bearish for Bitcoin and the crypto market because Bitcoin’s role as a safe-haven has been debunked. For example, Bitcoin dropped as Trump threatened to take over Greenland, and after he threatened tariffs on key NATO allies.
The rising risks explain why safe-haven assets like gold and the Swiss franc have soared. The gold price jumped to $5,320, while the Swiss franc has jumped by over 20% in the last 12 months.
Risky pattern in Bitcoin price means rally is a bull trap
Meanwhile, technical analysis suggests that the ongoing crypto market rally could be a dead-cat bounce.
The daily timeframe chart shows that Bitcoin remains below the 50-day and 100-day Exponential Moving Averages. It also remains below the Supertrend indicator.
The coin has also formed a bearish flag pattern, which happens when an asset drops and then forms a channel. This pattern often leads to a strong bearish breakdown.
Bitcoin may drop to the next key support level at $80,500, its lowest level in November last year. Such a move would mean a 10% drop from the current level. A drop below that price will signal further downside, potentially to last year’s low of $74,400.


")
