


XRP price is hovering near $1.30 after on-chain realized losses spiked to their highest level in 39 months.
Summary
- XRP is down across major timeframes and has retraced sharply from its 2025 high.
- On-chain data shows the largest realized loss spike since 2022.
- The $1.30 level is now the key support to watch.
XRP was trading at $1.32 at press time, down 4.7% in the past 24 hours. The token is in the red across all major timeframes, falling 7% over the past week, 30% in the last month, and nearly 48% over the past year.
XRP (XRP) has now retraced about 62% from its July 2025 all-time high of $3.65, closely reflecting the wider crypto market which has struggled to pick up pace.
Spot activity has picked up despite the price drop. XRP recorded $2.35 billion in 24-hour trading volume, up nearly 72% from the previous day, pointing to a rise in market participation during the sell-off.
Derivatives data from CoinGlass shows futures volume up 39% to $4.02 billion, while open interest rose 2.9% to $2.41 billion. The increase in both metrics suggests traders are adding positions as price tests a critical level.
On-chain losses spike as fear intensifies
On Feb. 22, blockchain analytics firm Santiment reported that XRP has recorded its largest on-chain realized loss spike since 2022.
The previous weekly realized loss peak, around -$1.93 billion, occurred 39 months ago. Following that event, XRP went on to rally more than 100% over the next several months.
Realized losses rise when investors sell tokens below their purchase price. This frequently occurs during sell-offs driven by panic. It can indicate that weaker holders are leaving the market, even though it also shows fear.
In the past, there have been notable increases in realized losses near market bottoms. Under such conditions, there are fewer sellers left to drive prices down after the majority of emotional selling has occurred. That can raise the likelihood of a relief move, but it does not ensure an instant rebound.
XRP price technical analysis
The daily chart shows a clear sequence of lower highs and lower lows since the January bounce. XRP trades below its 20-day moving average and has been riding the lower Bollinger Band, which points to sustained downside pressure.
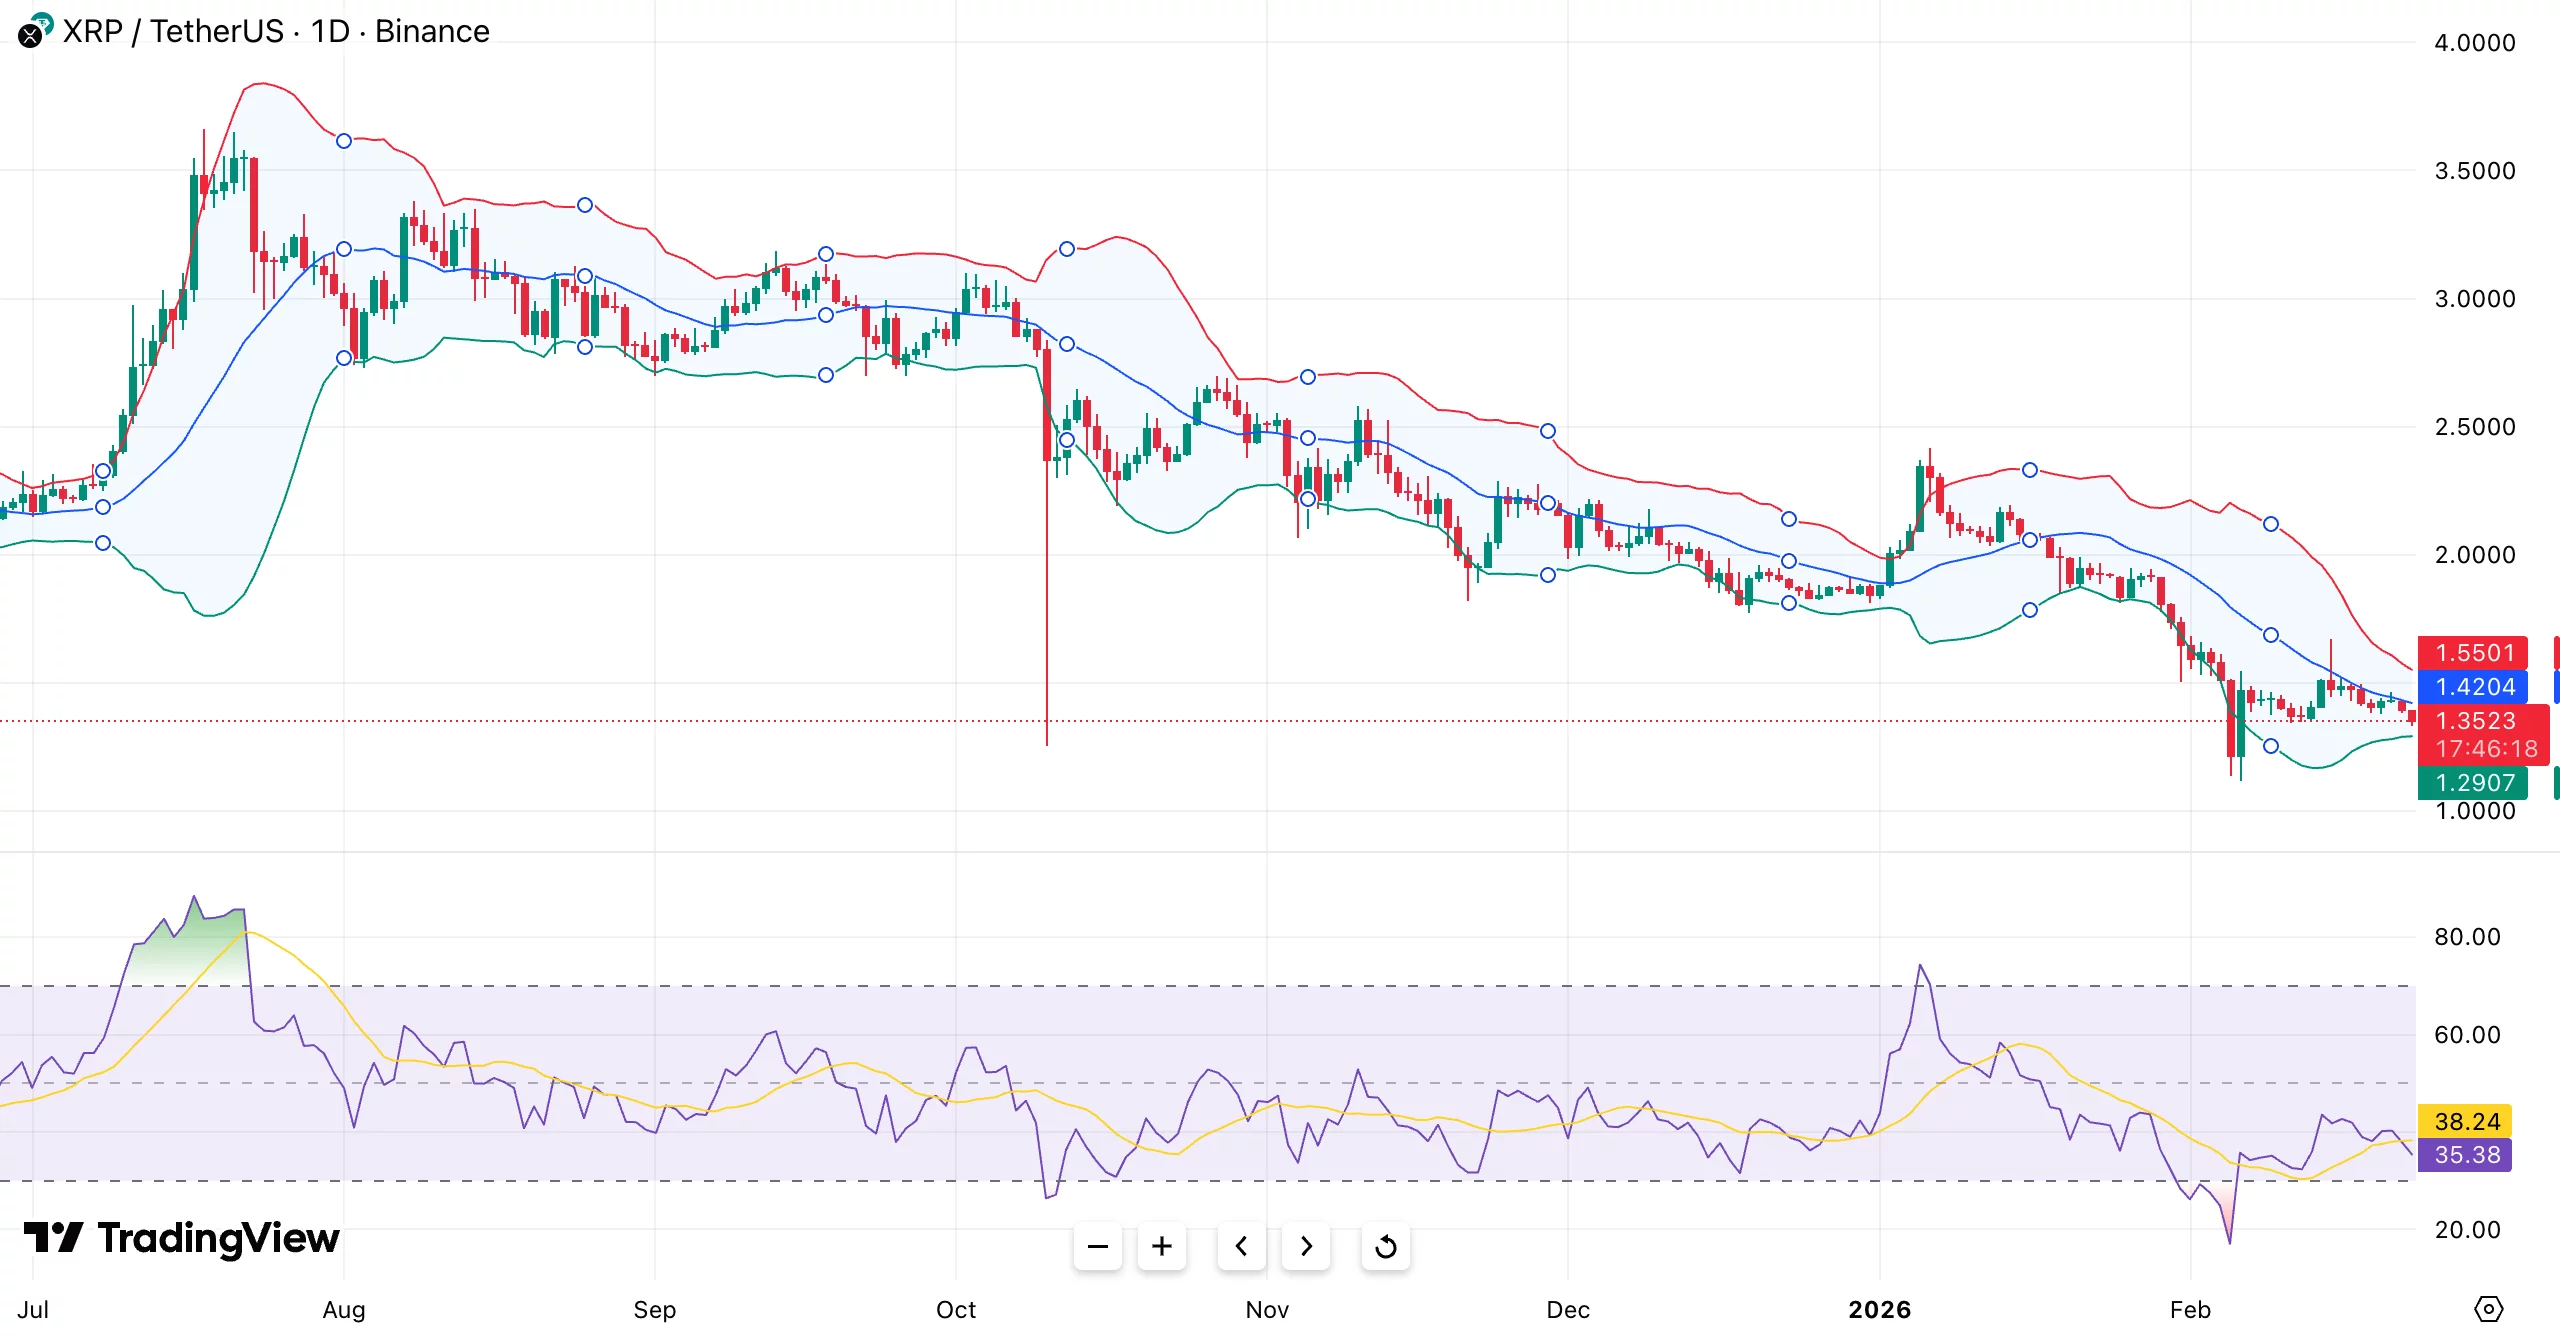
The $1.30–$1.35 area is the main level to watch. Price briefly dipped below $1.30 and recovered, showing some reactive buying.
The relative strength index dropped near 30 and is now in the mid-30s. There is no verified bullish divergence, but this points to a slight oversold bounce. Recovery strength would increase if the RSI rose above 50.
Immediate resistance sits between at about $1.55. The mid-Bollinger Band near $1.42 acts as the first hurdle. Until XRP reclaims that level, sellers retain short-term control. On the downside, a daily close below $1.30 could expose $1.20, followed by the psychological $1.00 level.