


Bitcoin price has stabilized near $62,500 after a weekend plunge below $62,000, while renewed U.S.-Iran hostilities and an oil surge have kept analysts cautious before U.S. inflation data.
Summary
- Bitcoin price held around $62,500 as traders weighed Trump’s Strait of Hormuz blockade ahead of the U.S. CPI report.
- Technical indicators show resistance near $63,100-$64,700, while analysts warn a break below $62,000 could trigger deeper losses.
- Rising oil prices, ETF outflows, and liquidation clusters have left Bitcoin vulnerable to sharp post-CPI volatility.
According to data from crypto.news, Bitcoin (BTC) price traded at about $62,504 on July 14 after moving between an intraday low of $61,794 and a high of $63,063. The recovery has remained limited after sellers rejected the asset above $64,000 and forced a fast retreat toward the lower end of its July range.
Brent crude climbed above $85 per barrel after President Donald Trump announced the return of a U.S. naval blockade on Iran and a 20% charge on cargo shipped through the Strait of Hormuz. Higher fuel costs could complicate the inflation outlook and reduce the case for easier monetary policy.
The June U.S. CPI report is scheduled for 8:30 a.m. Eastern Time, followed by Federal Reserve Chair Kevin Warsh’s testimony before the House Financial Services Committee at 10 a.m. A stronger inflation print or hawkish remarks could lift bond yields and weigh on Bitcoin, while softer data may help buyers challenge resistance.
Farside Investors recorded $424.7 million in net outflows from U.S. spot Bitcoin ETFs on July 13, including $185.5 million from BlackRock’s IBIT and $245.6 million from Fidelity’s FBTC. The withdrawals reversed the previous session’s $90.4 million inflow and reduced a key source of spot demand.
Bitcoin price has failed to reclaim $63,100 resistance
On the daily chart, Bitcoin remains below the 0.786 Fibonacci retracement at $63,131, drawn from the May peak near $82,844 to the June low around $57,765. A daily close above that level would improve the recovery setup and place the $64,000–$64,690 zone back in focus.
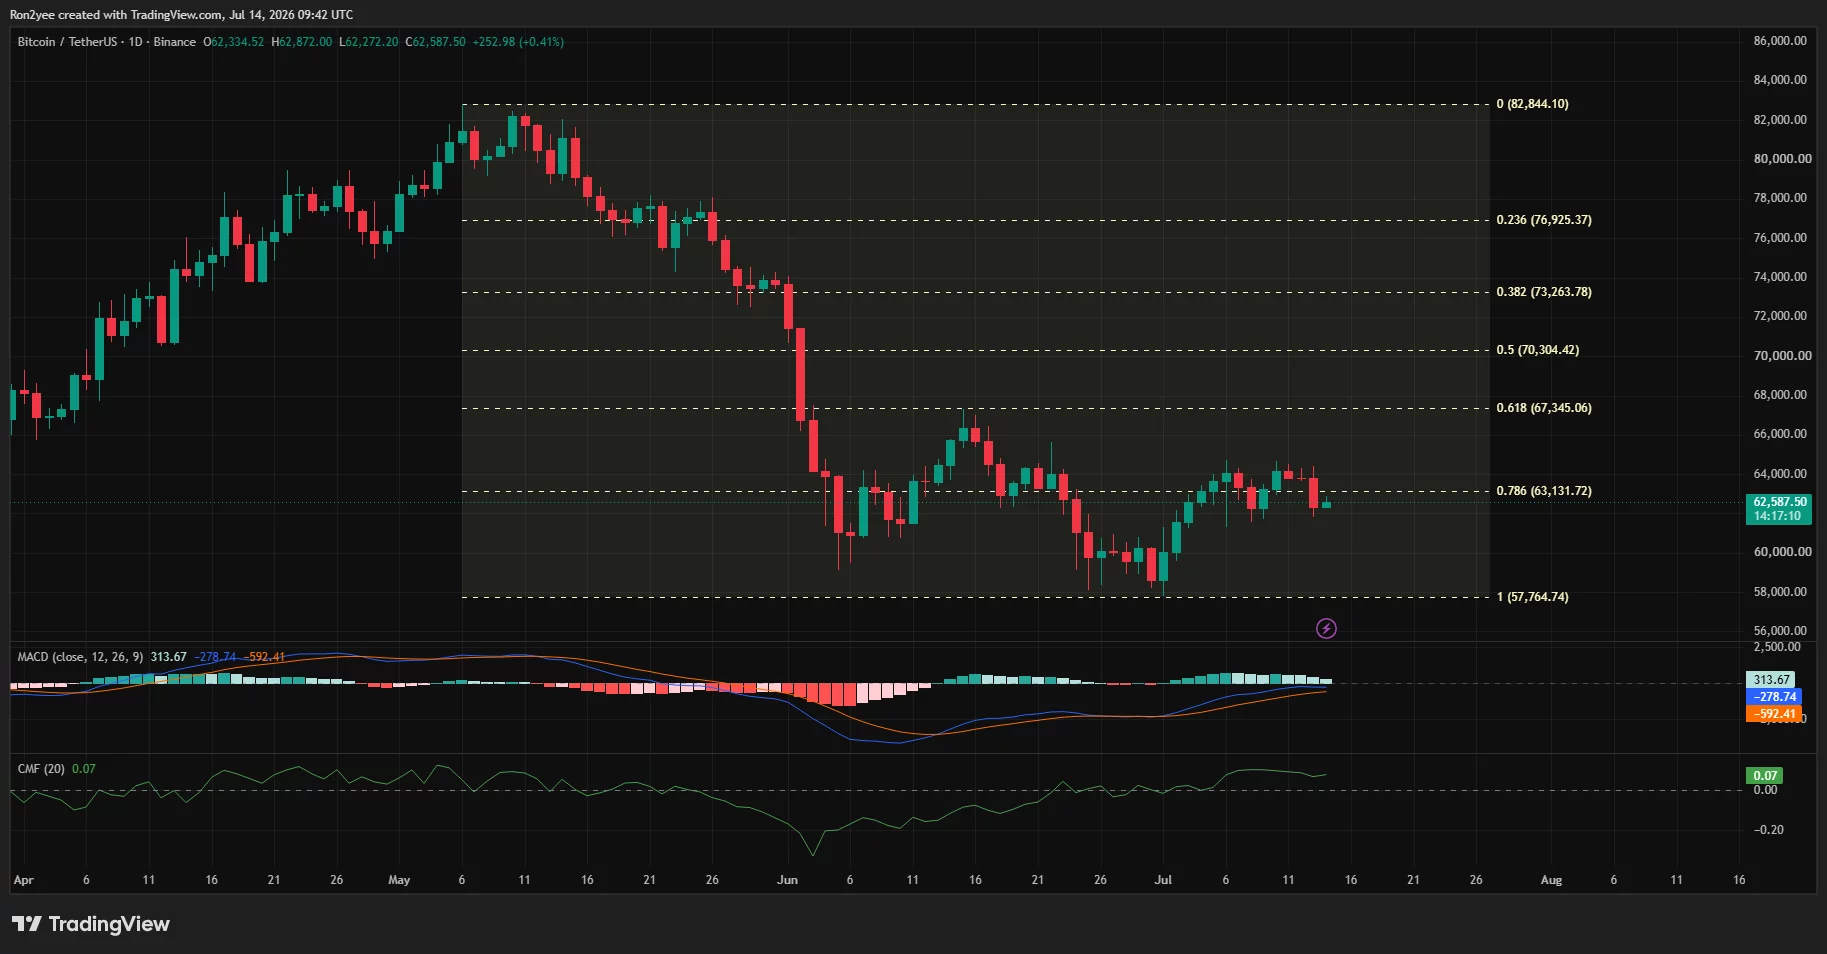
The daily MACD line has crossed above its signal line, but both remain below zero, while the positive histogram has narrowed during the latest pullback. Chaikin Money Flow stands at 0.07, slightly above zero, though price has not cleared resistance.
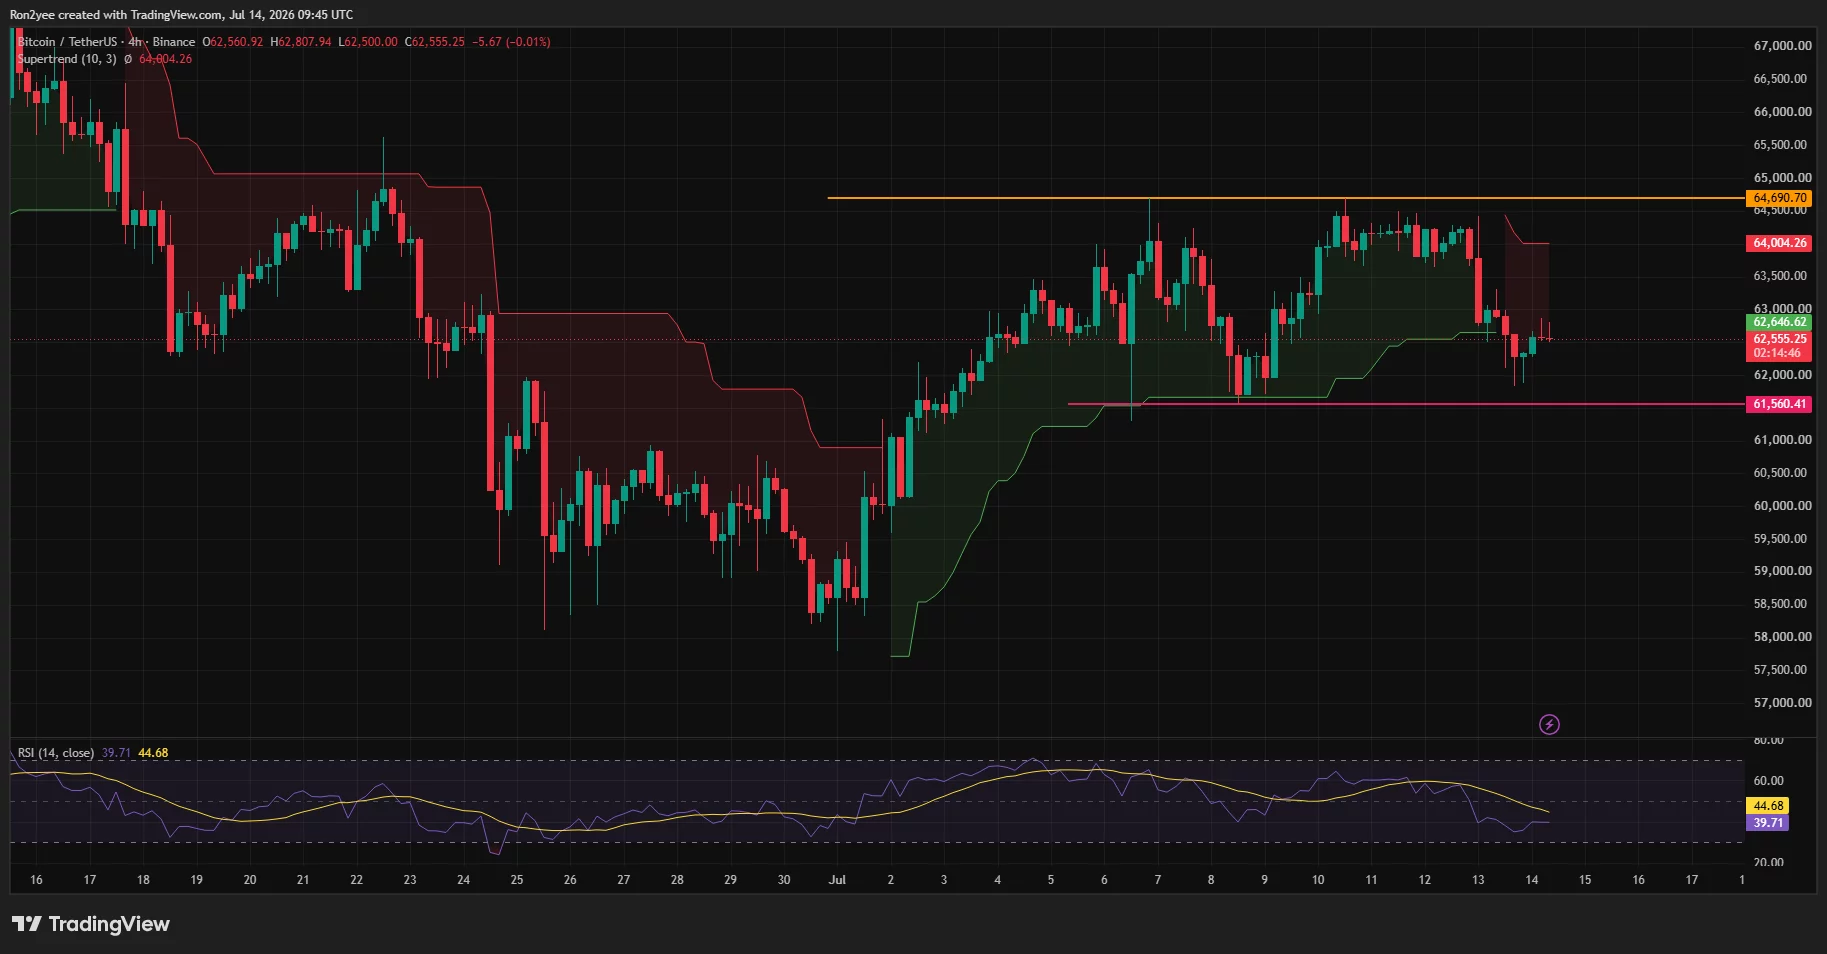
On the 4-hour chart, Bitcoin trades below the Supertrend barrier at $64,004, while the RSI sits at 39.71 and below its 44.68 moving average. Immediate support lies near $61,560, with the main range ceiling at $64,690.
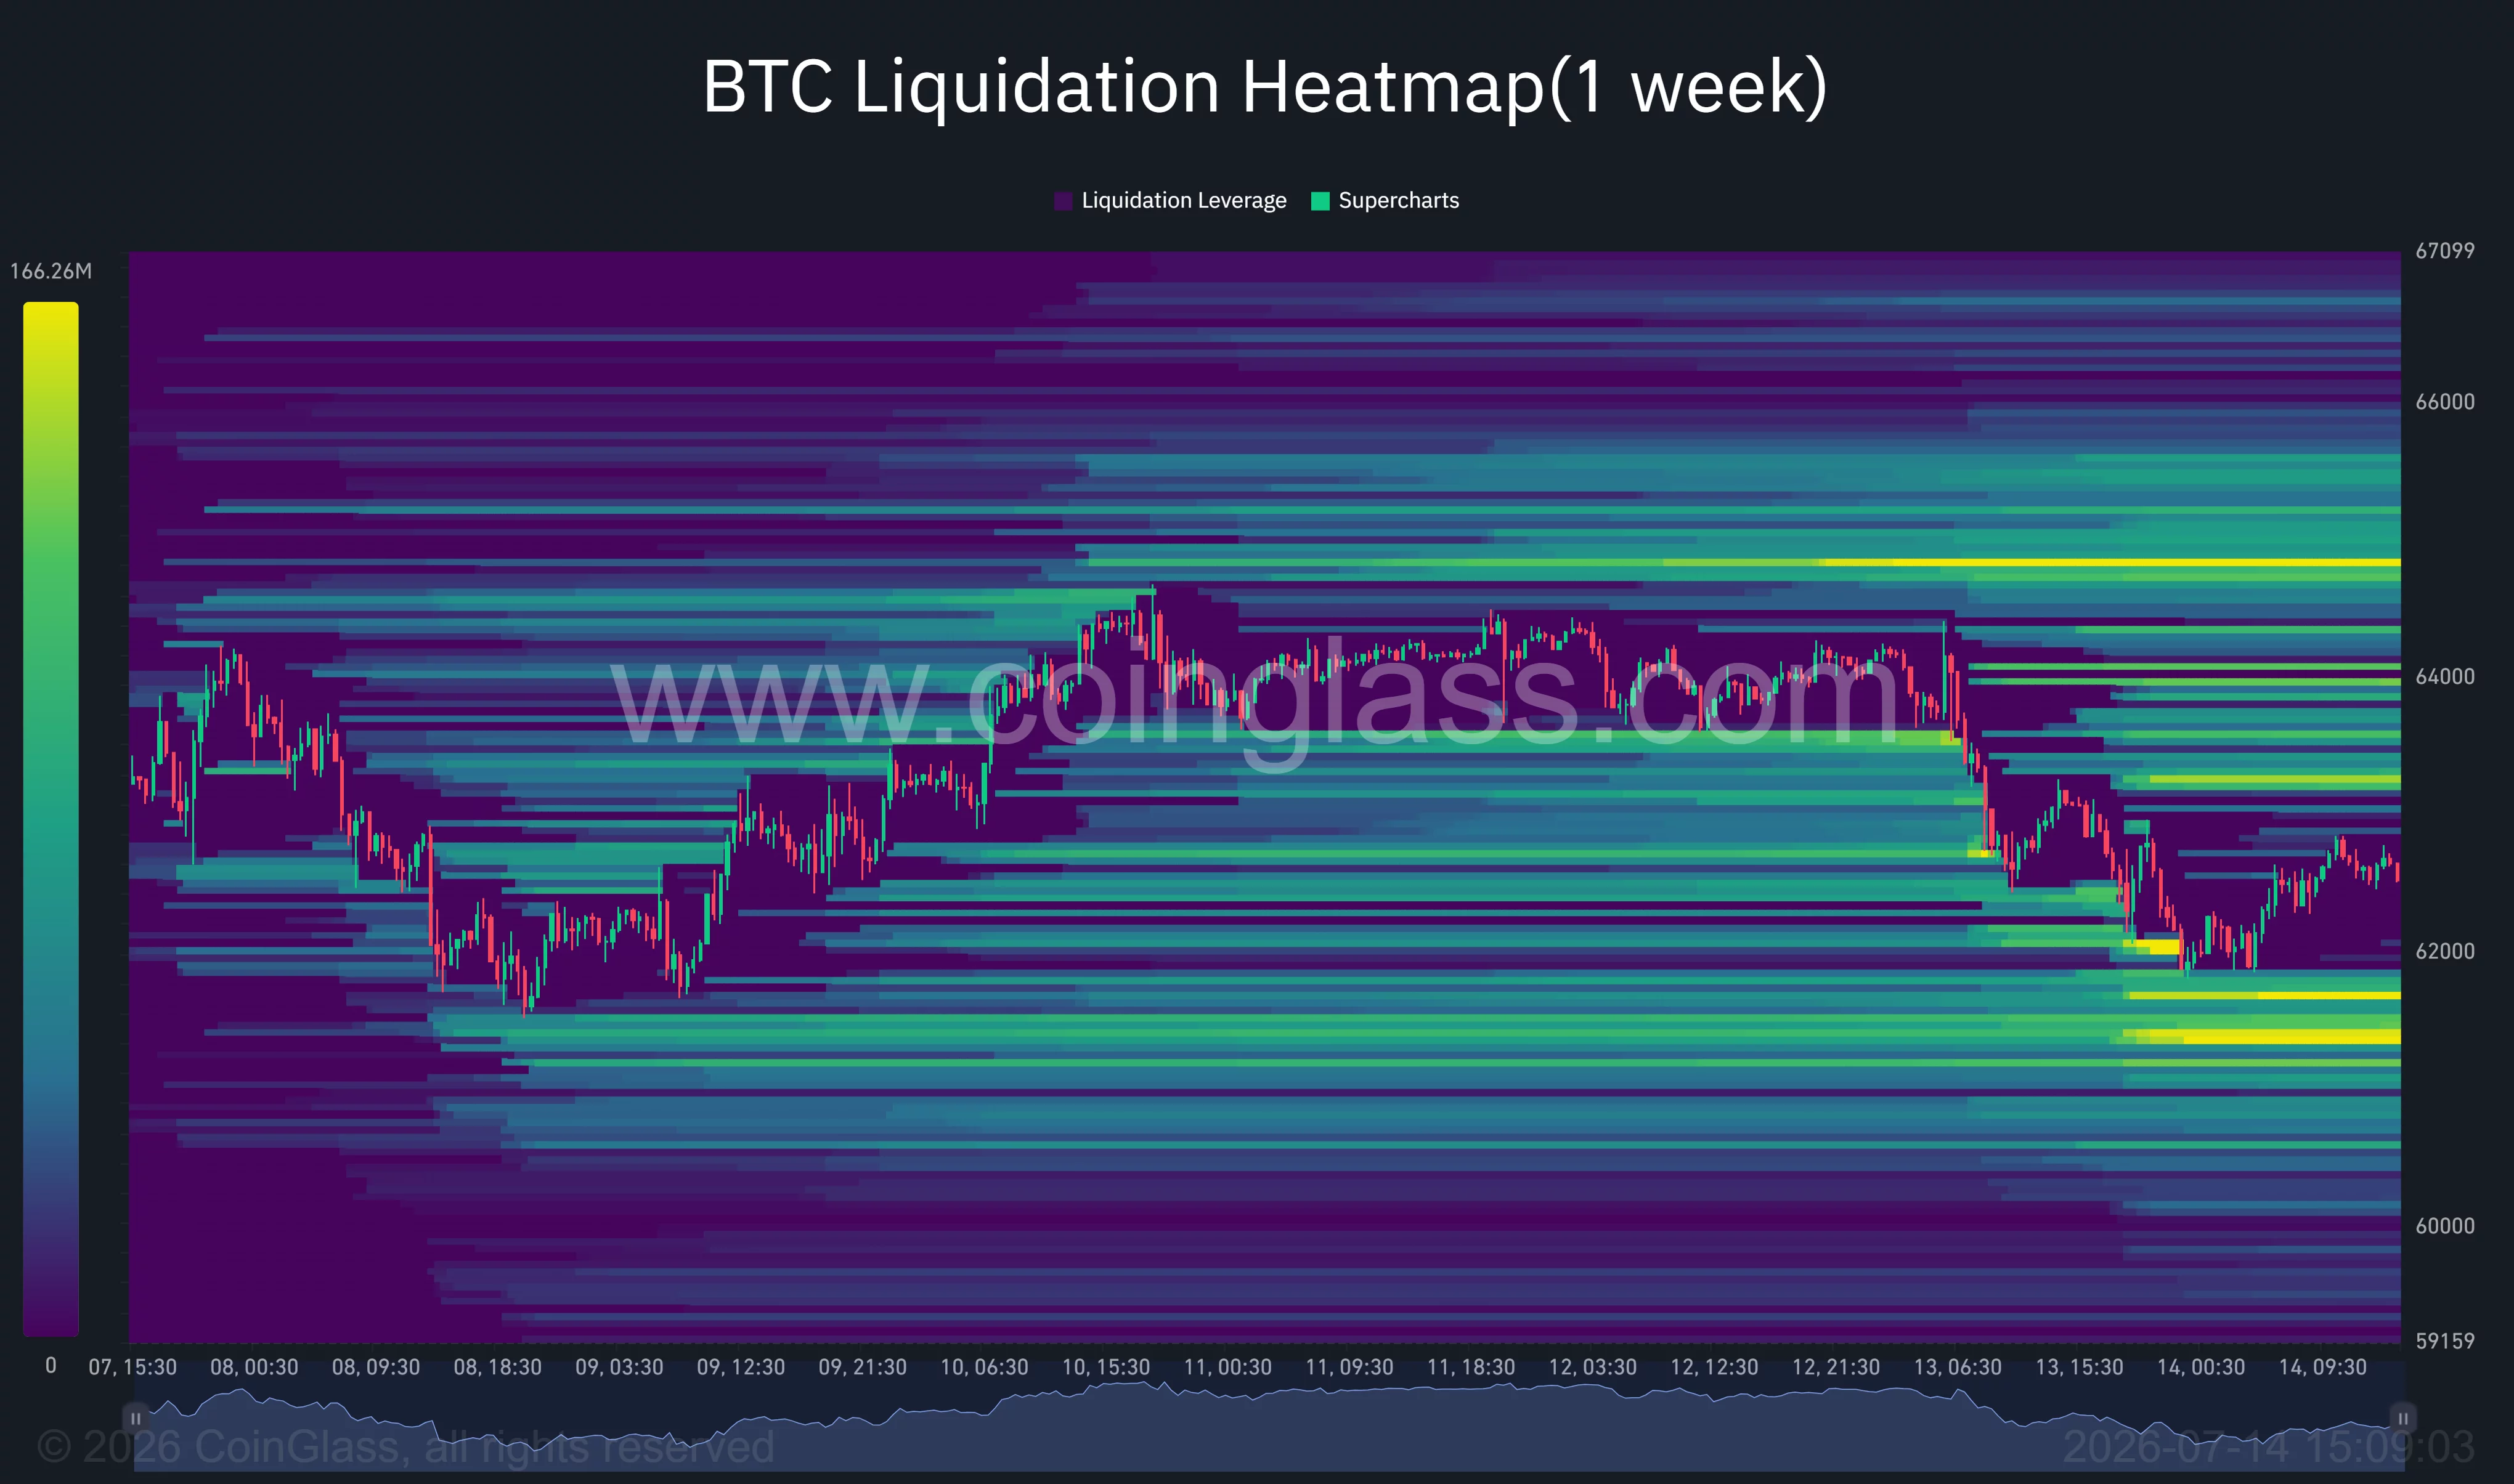
CoinGlass’s one-week liquidation heatmap shows dense leverage around $61,000–$61,500 below price and another large cluster near $64,800–$65,000 above it. According to crypto analyst Lennaert Snyder, open interest rose during the latest drop as spot selling increased and funding stayed positive.
“If CPI triggers enough volatility and pushes price towards the 63.5K zone, I’m shorting the reaction towards 60.4K,” Snyder wrote.
A close below $62,000 would expose $60,400
Commenting on the key invalidation level, crypto analyst Ted Pillows noted that Bitcoin was still holding $62,500 but warned:
“A daily close below $62,000-$62,500 would be bad for Bitcoin.”
A breakdown below $61,560 would expose Snyder’s $60,400 target, followed by the monthly open near $58,700 and the daily swing low at $57,765. Renewed attacks near the Strait of Hormuz, another oil surge, persistent ETF withdrawals, or a hawkish CPI reaction would raise the chance of that move.
Bulls need to recover $63,131 first, then close above the Supertrend at $64,004 and horizontal resistance at $64,690. Until those levels fall, Bitcoin remains trapped between liquidation liquidity on both sides, with macro data likely to decide which cluster is tested first.
Disclosure: This article does not represent investment advice. The content and materials featured on this page are for educational purposes only.