



PEPE price has held near $0.00000439 after its September rebound, with an amended U.S. ETF filing adding a regulatory development as the token approaches resistance between $0.00000450 and $0.00000469.
Summary
- $0.00000417 marks nearby daily support, with $0.00000469 the next major Fibonacci resistance.
- Canary Capital filed an amended registration statement for its proposed PEPE ETF on Oct. 2.
- PEPE’s weekly chart shows a falling-wedge breakout, while money flow remains slightly negative.
- CoinGlass shows a prominent liquidation cluster around $0.00000464, above the token’s current price.
TradingView’s Binance PEPE/USDT daily chart showed the token at $0.00000438 on Oct. 5, down 0.68% from the session’s opening price. The daily high reached $0.00000458, while the low stood at $0.00000434.
PEPE remains above its September lows, although the daily chart shows a retreat from the late-September peak near $0.00000536. October’s opening setup therefore combines a recovery from lower levels with resistance left by that earlier surge.
PEPE faces resistance before another $0.0000050 test
The daily Fibonacci levels place PEPE between the 61.8% retracement at $0.00000417 and the 78.6% level at $0.00000469. Holding the lower boundary would preserve the current consolidation above $0.0000040, while clearing the upper boundary would strengthen the chart-based case for another advance.
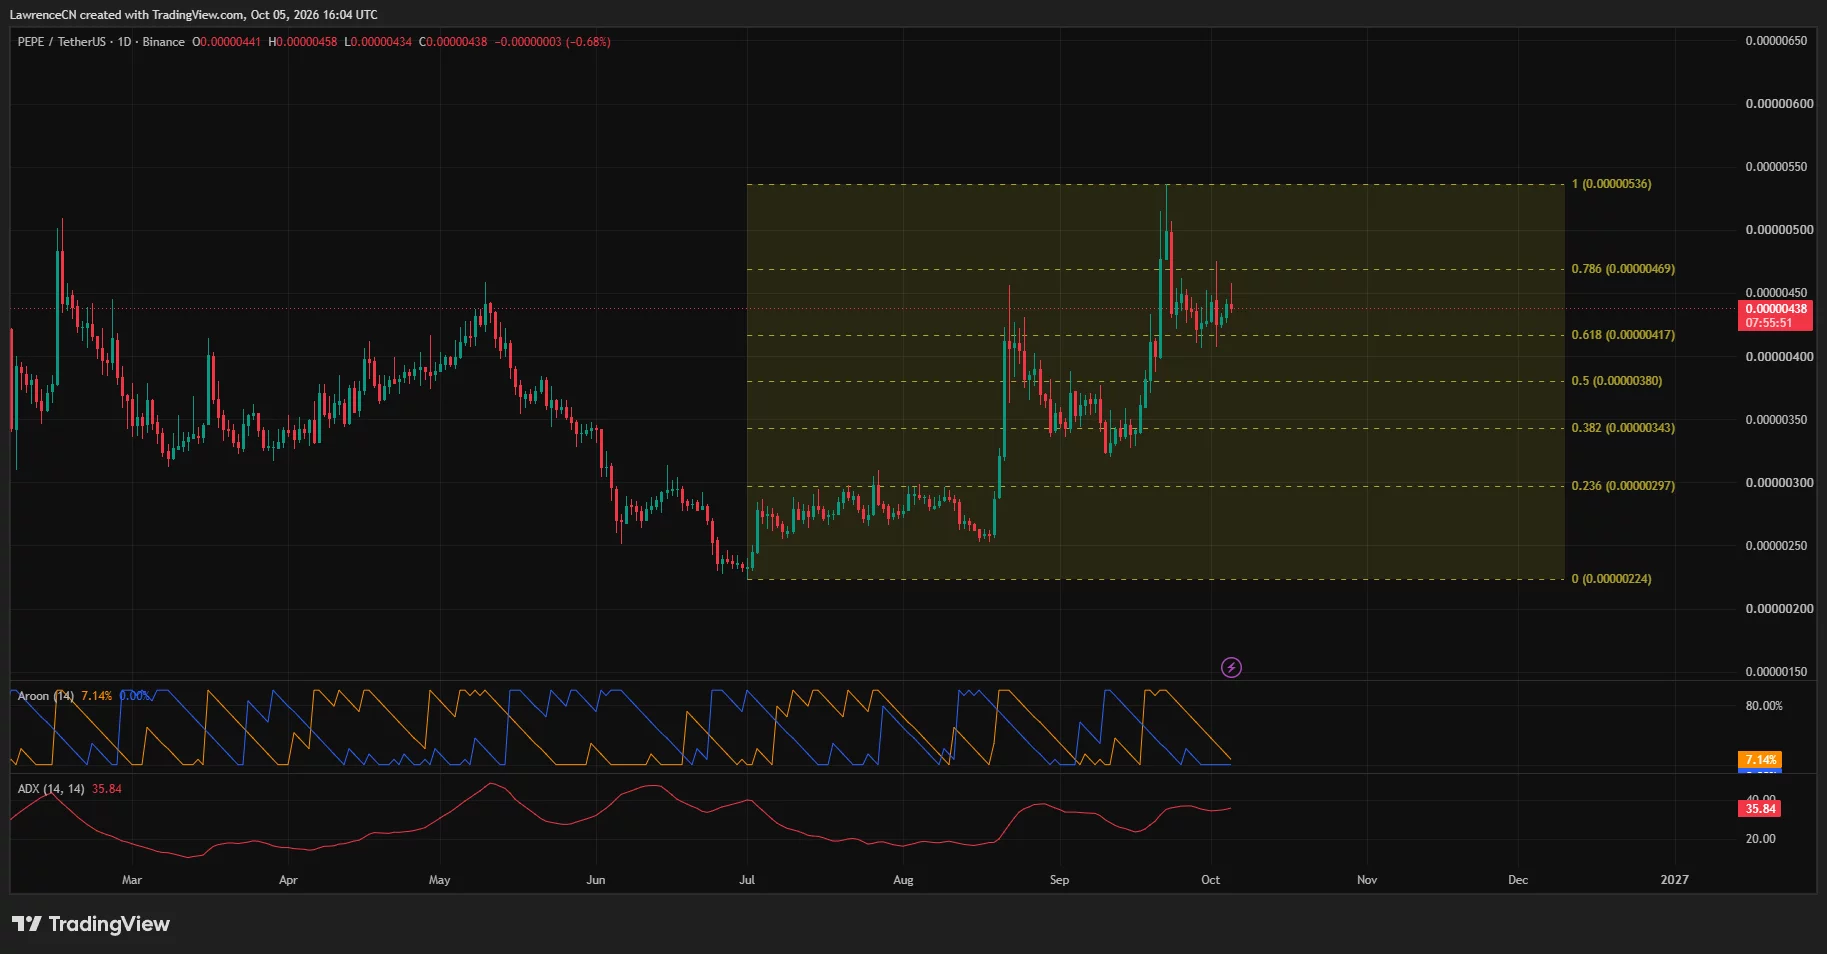
A move through $0.00000458, the Oct. 5 session high, would be an initial step toward the larger resistance. From approximately $0.00000439, reaching $0.00000469 would represent a gain of about 6.8%.
Above that level, the round-number threshold at $0.0000050 sits roughly 13.9% higher than the reference price. The September peak and top of the Fibonacci range at $0.00000536 would follow, requiring an advance of about 22.1%.
Technical commentator Bitfunded identified a similar sequence in an Oct. 5 X post. The account placed support around $0.00000408 and resistance at $0.00000450, with $0.00000504 as the next level if PEPE reclaimed resistance.
Bitfunded’s target is close to the psychological $0.0000050 threshold but below the September peak. Its outlook depends on a resistance reclaim rather than an immediate return to the previous high.
The daily chart’s ADX stood at 35.84. ADX measures trend strength rather than direction, so the reading needs to be considered alongside PEPE’s price structure and its position below the recent peak.
The two Aroon readings were also near the bottom of their ranges, at 7.14% and 0%. Alongside the sideways candles, those readings suggest that the September advance has moved into consolidation rather than a fresh directional breakout.
Weekly breakout meets weak money flow
TradingView’s weekly chart shows PEPE trading above two converging descending trendlines after breaking above the upper boundary of a falling wedge. The formation follows a prolonged decline from the much higher prices recorded in late 2024.
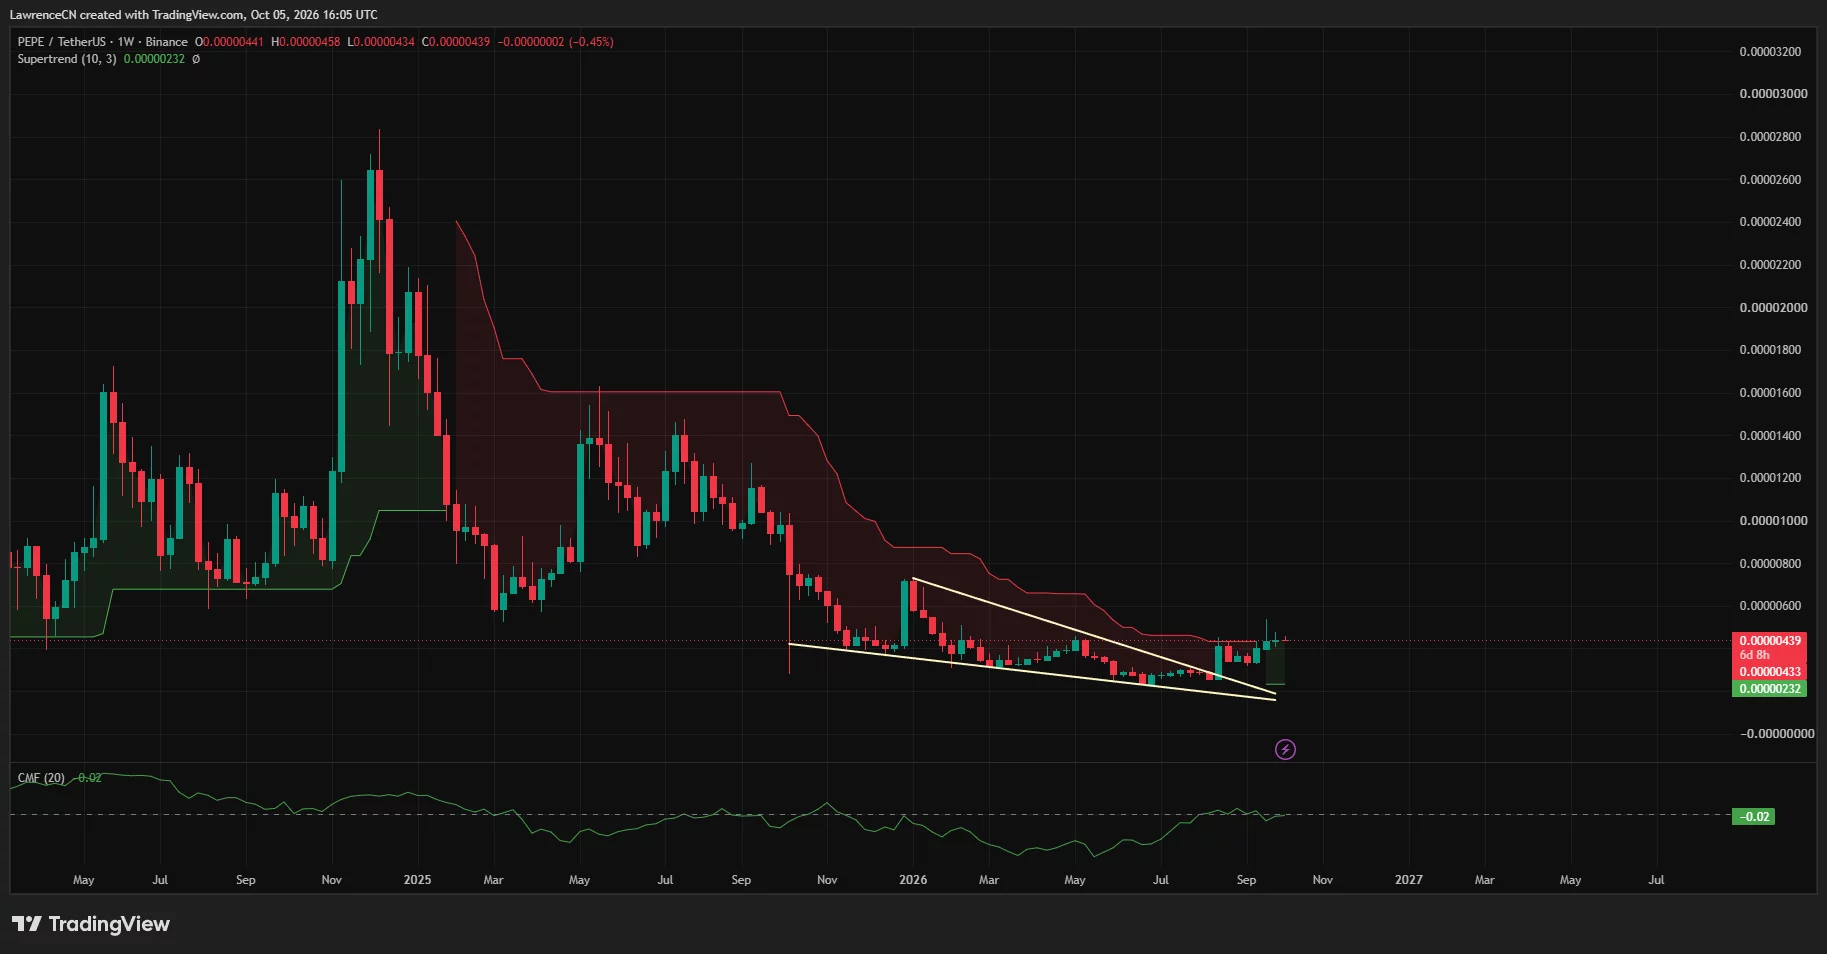
The weekly Supertrend had turned green, with its displayed level at $0.00000232. PEPE was trading above that line, although the distance between the indicator and price makes it a longer-term reference rather than nearby October support.
Weekly Chaikin Money Flow remained slightly negative at -0.02. The reading sits close to zero, leaving the breakout without a clear positive money-flow signal at the time of the chart reading.
X commentator Boots offered a bullish longer-term interpretation, saying PEPE had successfully retested a higher-timeframe breakout. The account compared the formation with the setup preceding PEPE’s 2024 expansion and described the token as trading like leveraged exposure to Ethereum.
Boots’ comparison concerns a broader recovery pattern rather than a dated October price target. For the nearer-term setup, the daily resistance levels remain the measurable barriers between the current price and another test of September’s high.
Canary’s ETF amendment adds a U.S. catalyst
SEC records show that Canary Capital filed an S-1 amendment for the proposed Canary PEPE ETF on Oct. 2. The original registration statement was filed on April 8, making the October submission an update to an existing proposal.
The preliminary prospectus proposes listing shares on Cboe BZX and holding PEPE to provide exposure to its price, less expenses and other liabilities. It names BitGo Bank & Trust as the token custodian.
Canary’s filing states that the securities cannot be sold until the registration statement becomes effective. The proposal would offer U.S. investors a brokerage-based route to PEPE exposure if it proceeds, while the amendment itself represents neither a fund launch nor confirmed investor inflows.
Liquidation bands frame October’s upside and downside
CoinGlass’s one-month liquidation heatmap shows a prominent band around $0.00000464, slightly below the daily Fibonacci resistance at $0.00000469. Additional overhead clusters appear around $0.0000048 and $0.0000051.
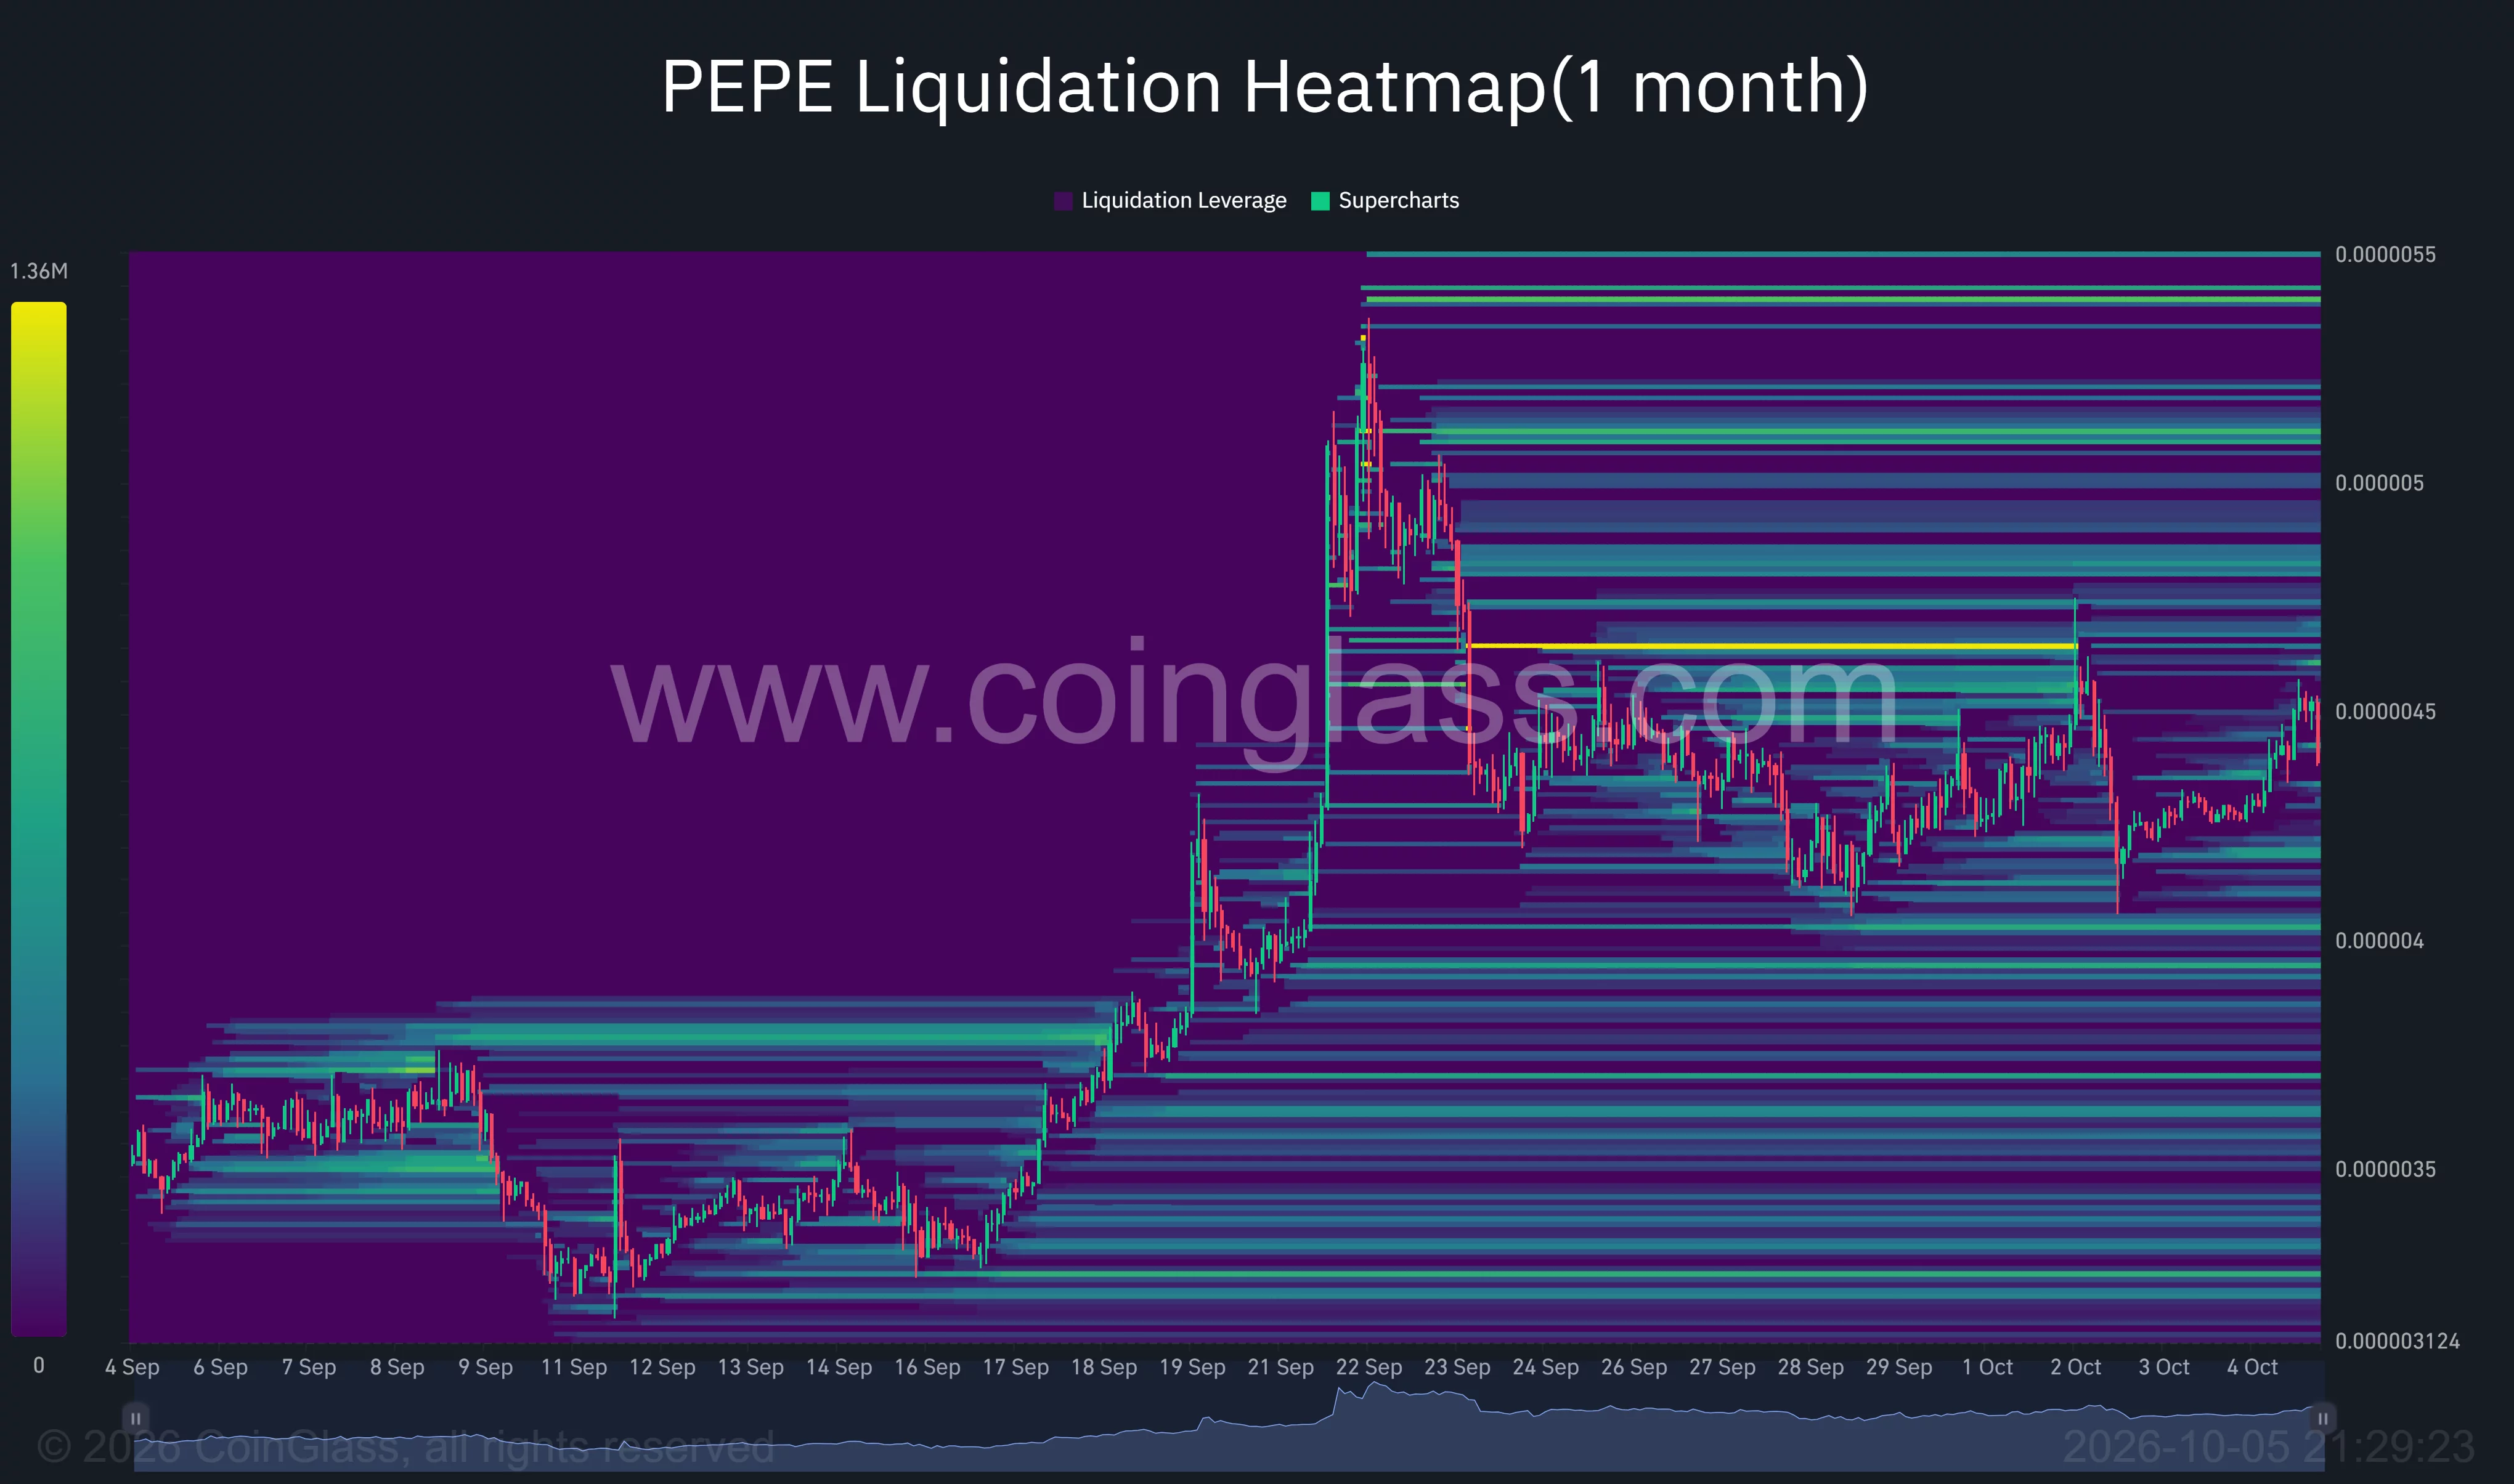
A rise into those areas could expose short positions to liquidation, potentially adding forced buying to an advance. The heatmap’s bands indicate estimated liquidation exposure rather than completed liquidations.
Below the market, visible clusters sit around $0.0000042 and $0.0000040. A decline toward those levels could instead put leveraged long positions under pressure.
The daily chart gives the downside scenario a more precise sequence. Losing $0.00000417 would weaken the current consolidation and bring the 50% Fibonacci level at $0.00000380 into view, about 13.4% below $0.00000439.
A deeper retreat would expose $0.00000343, the 38.2% retracement, representing a decline of about 21.9%. That move would erase a larger share of the recent recovery.
For October, the chart-based bullish scenario requires PEPE to defend $0.00000417 and clear $0.00000469 before targeting $0.0000050–$0.00000536. A break below support would shift the immediate technical focus toward $0.00000380, with $0.00000343 the next lower reference.
Disclosure: This article does not represent investment advice. The content and materials featured on this page are for educational purposes only.