



NEAR Protocol has recovered above $5 after falling to approximately $4.30 on October 8, but its price has struggled to break through the $5.30–$5.65 resistance area despite gaining roughly 9% over the past week.
Summary
- NEAR traded near $5.24 on October 11, remaining below the important $5.30 resistance area again.
- October 8 trading saw NEAR fall toward $4.30 before recovering above $5 during subsequent sessions.
- Analysts identified $5.65 as a potential breakout level, with $6 and $6.50 as conditional targets.
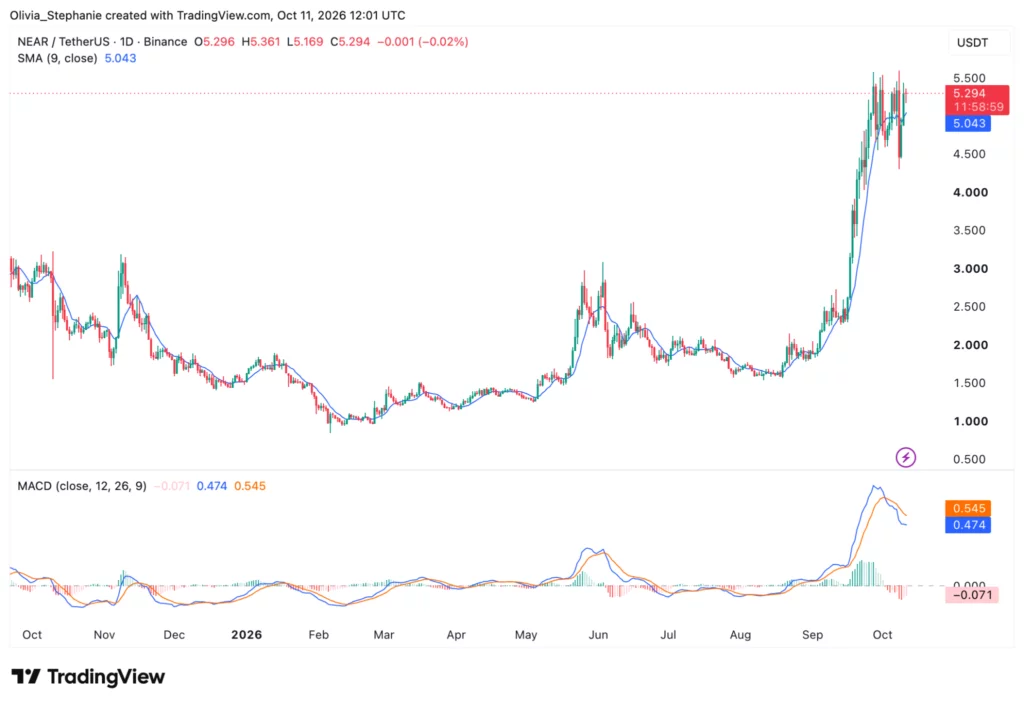
- The nine day moving average remained near $5.04, while the reported MACD histogram turned negative.
- CoinGecko recorded roughly $6.9 billion in market capitalization as NEAR traded above five dollars again.
According to U.Today’s October 11 analysis by Arman Shirinyan, NEAR was trading near $5.25 after recovering from a sharp market selloff, with repeated attempts to advance beyond $5.50 meeting selling pressure. The analysis identified $5.65 as a possible breakout level, while weaker trading volume raised questions about whether buyers could maintain the recent recovery. The proposed price targets remain conditional technical scenarios.
CoinGecko’s October 11 snapshot placed NEAR near $5.24, with a market capitalization of approximately $6.9 billion and more than 1.3 billion tokens in circulation.
NEAR price struggles to break through $5.30 resistance
After recovering from its August lows, NEAR has encountered repeated selling pressure between $5.30 and $5.65. TradingView and historical exchange data show that the cryptocurrency advanced from below $2 during August to above $5 by late September.
The rise brought NEAR close to its highest levels in several months, but buyers struggled to maintain trading above the $5.50 area.
U.Today’s chart analysis identified a local high near $5.56 in late September and another unsuccessful attempt near $5.65 in early October. In both cases, selling pressure prevented NEAR from establishing a sustained move above the resistance region.
The latest market data confirms that price volatility remained elevated during the first half of October.
On October 7, NEAR traded as high as approximately $5.44 before falling sharply during the following session. Historical figures from Investing.com show that NEAR reached an intraday low near $4.31 on October 8 after opening around $5.34. The cryptocurrency finished the day close to $4.47, recording a daily decline of approximately 16.3%.
Buyers returned during the next two sessions, lifting the price toward $4.89 on October 9 and approximately $5.29 on October 10.
However, the recovery did not produce a confirmed breakout above the previous highs. By October 11, NEAR had retreated toward $5.24, remaining within the resistance area identified in the original analysis. The repeated reversals have kept attention on whether the token can sustain a daily close above $5.65.
NEAR technical indicators show mixed momentum
Although NEAR has maintained much of its recent advance, some technical indicators suggest that upward momentum has weakened.
The October 11 TradingView analysis placed the cryptocurrency’s nine-day simple moving average near $5.038. With NEAR trading around $5.257 at the chart snapshot, the token remained above that short-term average. The moving average measures the average closing price over nine sessions and is commonly used to track short-term market direction.
However, the Moving Average Convergence Divergence indicator presented a less favorable reading. The supplied technical snapshot showed the MACD line at 0.471, below its signal line at 0.545.
Meanwhile, the MACD histogram stood at -0.074, indicating that the MACD line had moved below its signal line. The negative reading is consistent with slowing upward momentum, although it does not establish that a sustained price decline will follow.
An independent October 11 analysis from COINOTAG identified resistance around $5.44 and $5.79, with nearby support at approximately $5.11.
The service reported a relative strength index near 60.6 on its daily chart. An RSI reading above 50 generally indicates stronger recent gains than losses over the indicator’s measurement period, while a reading below 70 does not meet the commonly used overbought threshold.
The figures were recorded at different chart snapshots, meaning the indicator readings cannot be treated as simultaneous market measurements.
COINOTAG classified NEAR’s daily trend as bullish while identifying elevated volatility. Its resistance estimates differ slightly from the $5.65 breakout threshold used in U.Today’s analysis because technical services apply different calculations and chart settings.
Can NEAR price reach $6 or $6.50?
U.Today’s October 11 analysis outlined two possible scenarios based on whether buyers can overcome the resistance around $5.65.
Under the bullish scenario, NEAR would need to close a full daily trading session above $5.65 while recording stronger trading volume.
A successful move would place $6.00 in focus as the first potential upside target. If buyers maintained the advance above that level, the analysis identified $6.50 as another possible resistance area.
However, the scenario depends on NEAR sustaining its price above the former resistance zone. A temporary move above $5.65 without a convincing daily close would not satisfy the confirmation described in the analysis. The report further identified $5.00 as an important level for determining whether buyers continue supporting the cryptocurrency during pullbacks.
If the price returns to that region and rebounds, the technical setup could remain intact. A separate October 6 analysis of NEAR’s 135% monthly rally identified a resistance area extending from $5.50 to $6.20. That report cited analyst Rekt Capital’s observations about NEAR testing a former downward trendline after its recent advance.
The analysis discussed a possible move toward $8 and eventually $12, but only if the cryptocurrency maintained the required support levels and overcame higher resistance. Those longer-range targets were separate from the October 11 chart scenario and did not represent confirmed forecasts. At the October 11 trading price, NEAR had not yet met the breakout conditions identified in either assessment.
What happens if NEAR falls below $5?
The alternative scenario centers on another unsuccessful attempt to break above the resistance area. A sustained move below that level would weaken the latest recovery pattern, according to the chart assessment.
Further selling could bring the price toward $4.45, close to the region where buyers returned after the October 8 decline.
Below $4.45, the next level identified in the analysis was $4.00. Historical trading data supports the importance of the recent low, with NEAR recovering from approximately $4.31 on October 8 after a sharp intraday decline. The subsequent rebound demonstrated that buyers returned at lower prices during that session, although it does not guarantee similar buying interest during another selloff.
An October 1 report on NEAR’s earlier pullback identified support near $4.69 after the cryptocurrency fell below $5 following a previous attempt to trade above $5.50.
The report documented a separate incident involving NEAR Intents, a cross-chain transaction service connected to the ecosystem.
NEAR Intents announced on October 1 that it had paused certain services after detecting a contract-related security problem. The team said it had patched the affected system and committed to reimbursing impacted users.
According to the October 1 reporting, the disruption affected the cross-chain service, not the underlying NEAR blockchain.
The team contacted law enforcement and worked with blockchain analytics and security specialists to investigate the incident. The available information does not establish that the October 11 price resistance resulted from that earlier event.
NEAR trading volume remains important after the recovery
Trading volume has fluctuated sharply during NEAR’s recent advance and correction. Historical data from Investing.com shows approximately 81.95 million NEAR traded on October 8, when the price fell more than 16%.
By October 10, the same dataset recorded volume of roughly 34.88 million NEAR as the cryptocurrency recovered toward $5.29. The lower token volume accompanied a daily price increase of approximately 8.2%, based on that exchange data.
Meanwhile, CoinGecko recorded approximately $903 million in dollar-denominated trading volume on October 10, following around $1.53 billion on October 9.
The two datasets use different volume measures: Investing.com’s figures are expressed in NEAR tokens, while CoinGecko reports estimated trading value in U.S. dollars across tracked markets. For the proposed breakout scenario, U.Today’s analysis requires an increase in volume alongside a confirmed daily close above $5.65.
The report specified that volume should remain elevated if price returns to retest the breakout area. Conversely, if NEAR fails to advance through resistance, the same analysis identifies a move below $4.90 as the first warning that the recent recovery may be weakening. The next daily closes around $5.30 and $5.65 will determine whether the specific breakout conditions described in the October 11 chart assessment have been met.
Disclosure: This article does not represent investment advice. The content and materials featured on this page are for educational purposes only.