The Bitget Token price continued soaring this week even as the Santa Claus rally in the crypto industry remained elusive.
Bitget Token (BGB) jumped to a high of $4.97, meaning that it has soared by over 470% from its lowest level this year.
It is unclear why this surge has happened, but it is likely because of its growing market share in the crypto industry. CoinGecko data shows that it has become the eighth biggest exchange in the industry, handling over $91 billion in volume last month.
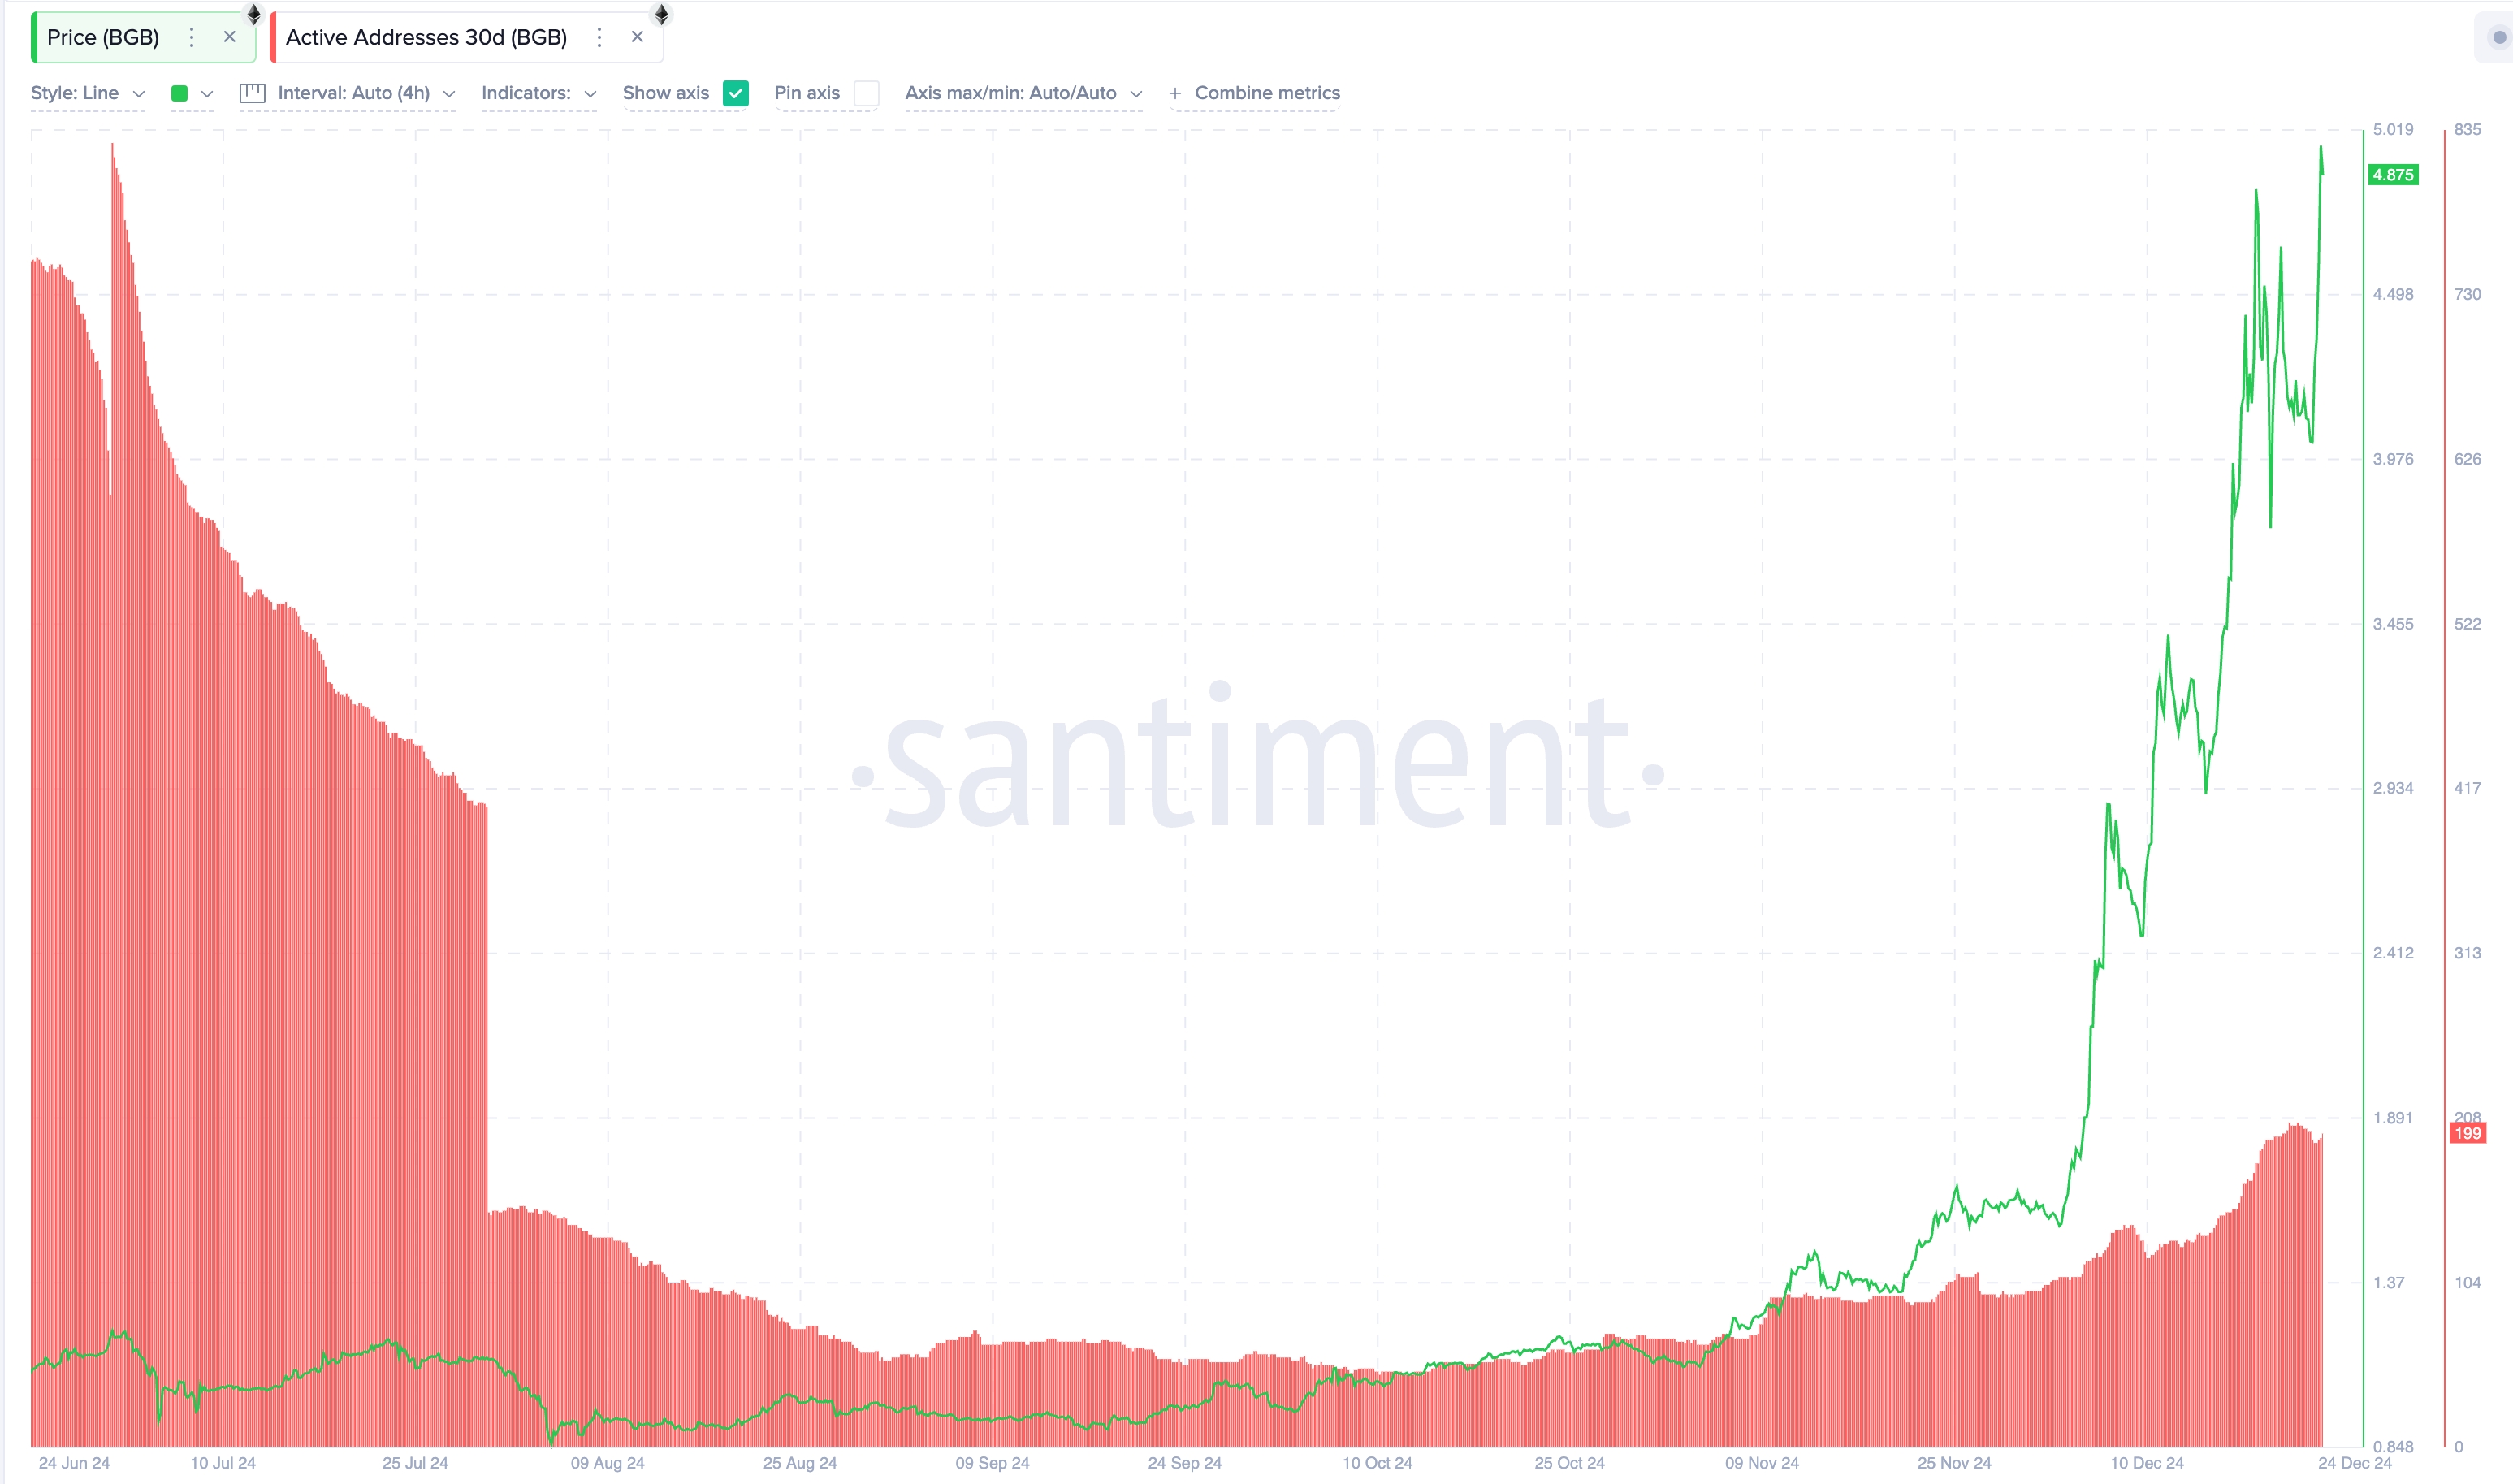
On-chain data shows that the BGB price surge has attracted some Fear of Missing Out as the number of active addresses rose. Its 30-day active addresses rose to almost 200, up from less than 100 in October.

Bitget Token price MVRV indicator soars
There are a few reasons why the BGB price may retreat in the coming days. First, there are signs that it has moved into the markup phase of the Wyckoff Method. This phase comes after a long period of accumulation, which, in this case, lasted over two years. It is usually characterized by higher supply than demand and is followed by distribution and markdown.
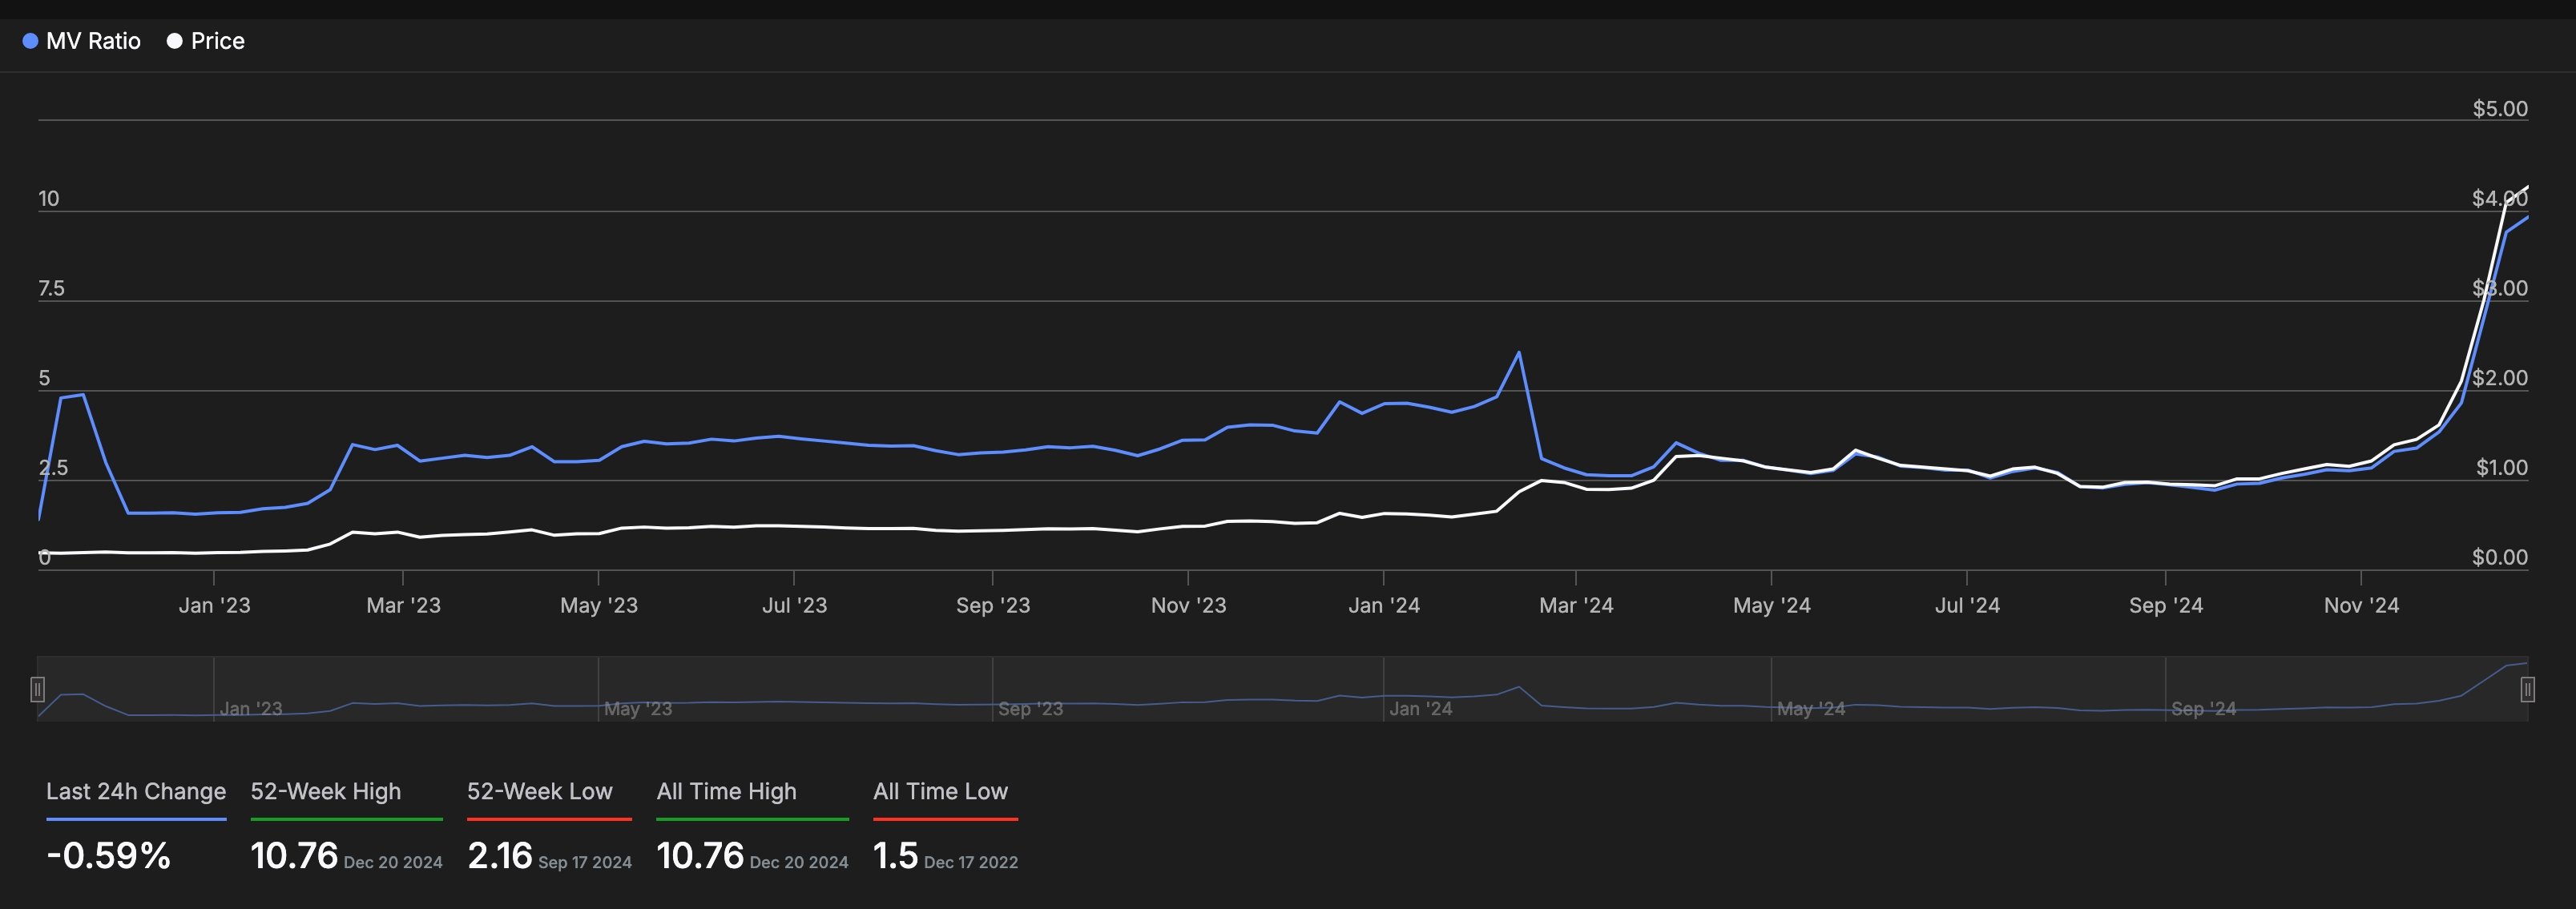
Second, data by IntoTheBlock shows that the market value to realized value has soared to 9.83, a record high. This is a popular indicator that compares a cryptocurrency’s market value and its realized value and then finds its standard deviation.
As we wrote on Bitcoin, an asset is said to be in the overbought zone when the MVRV indicator moves above 3.8. In BGB’s case, this figure has moved to 9.83, meaning that it has become extremely overbought, which could lead to a pullback.

BGB is overbought, and mean reversion is possible

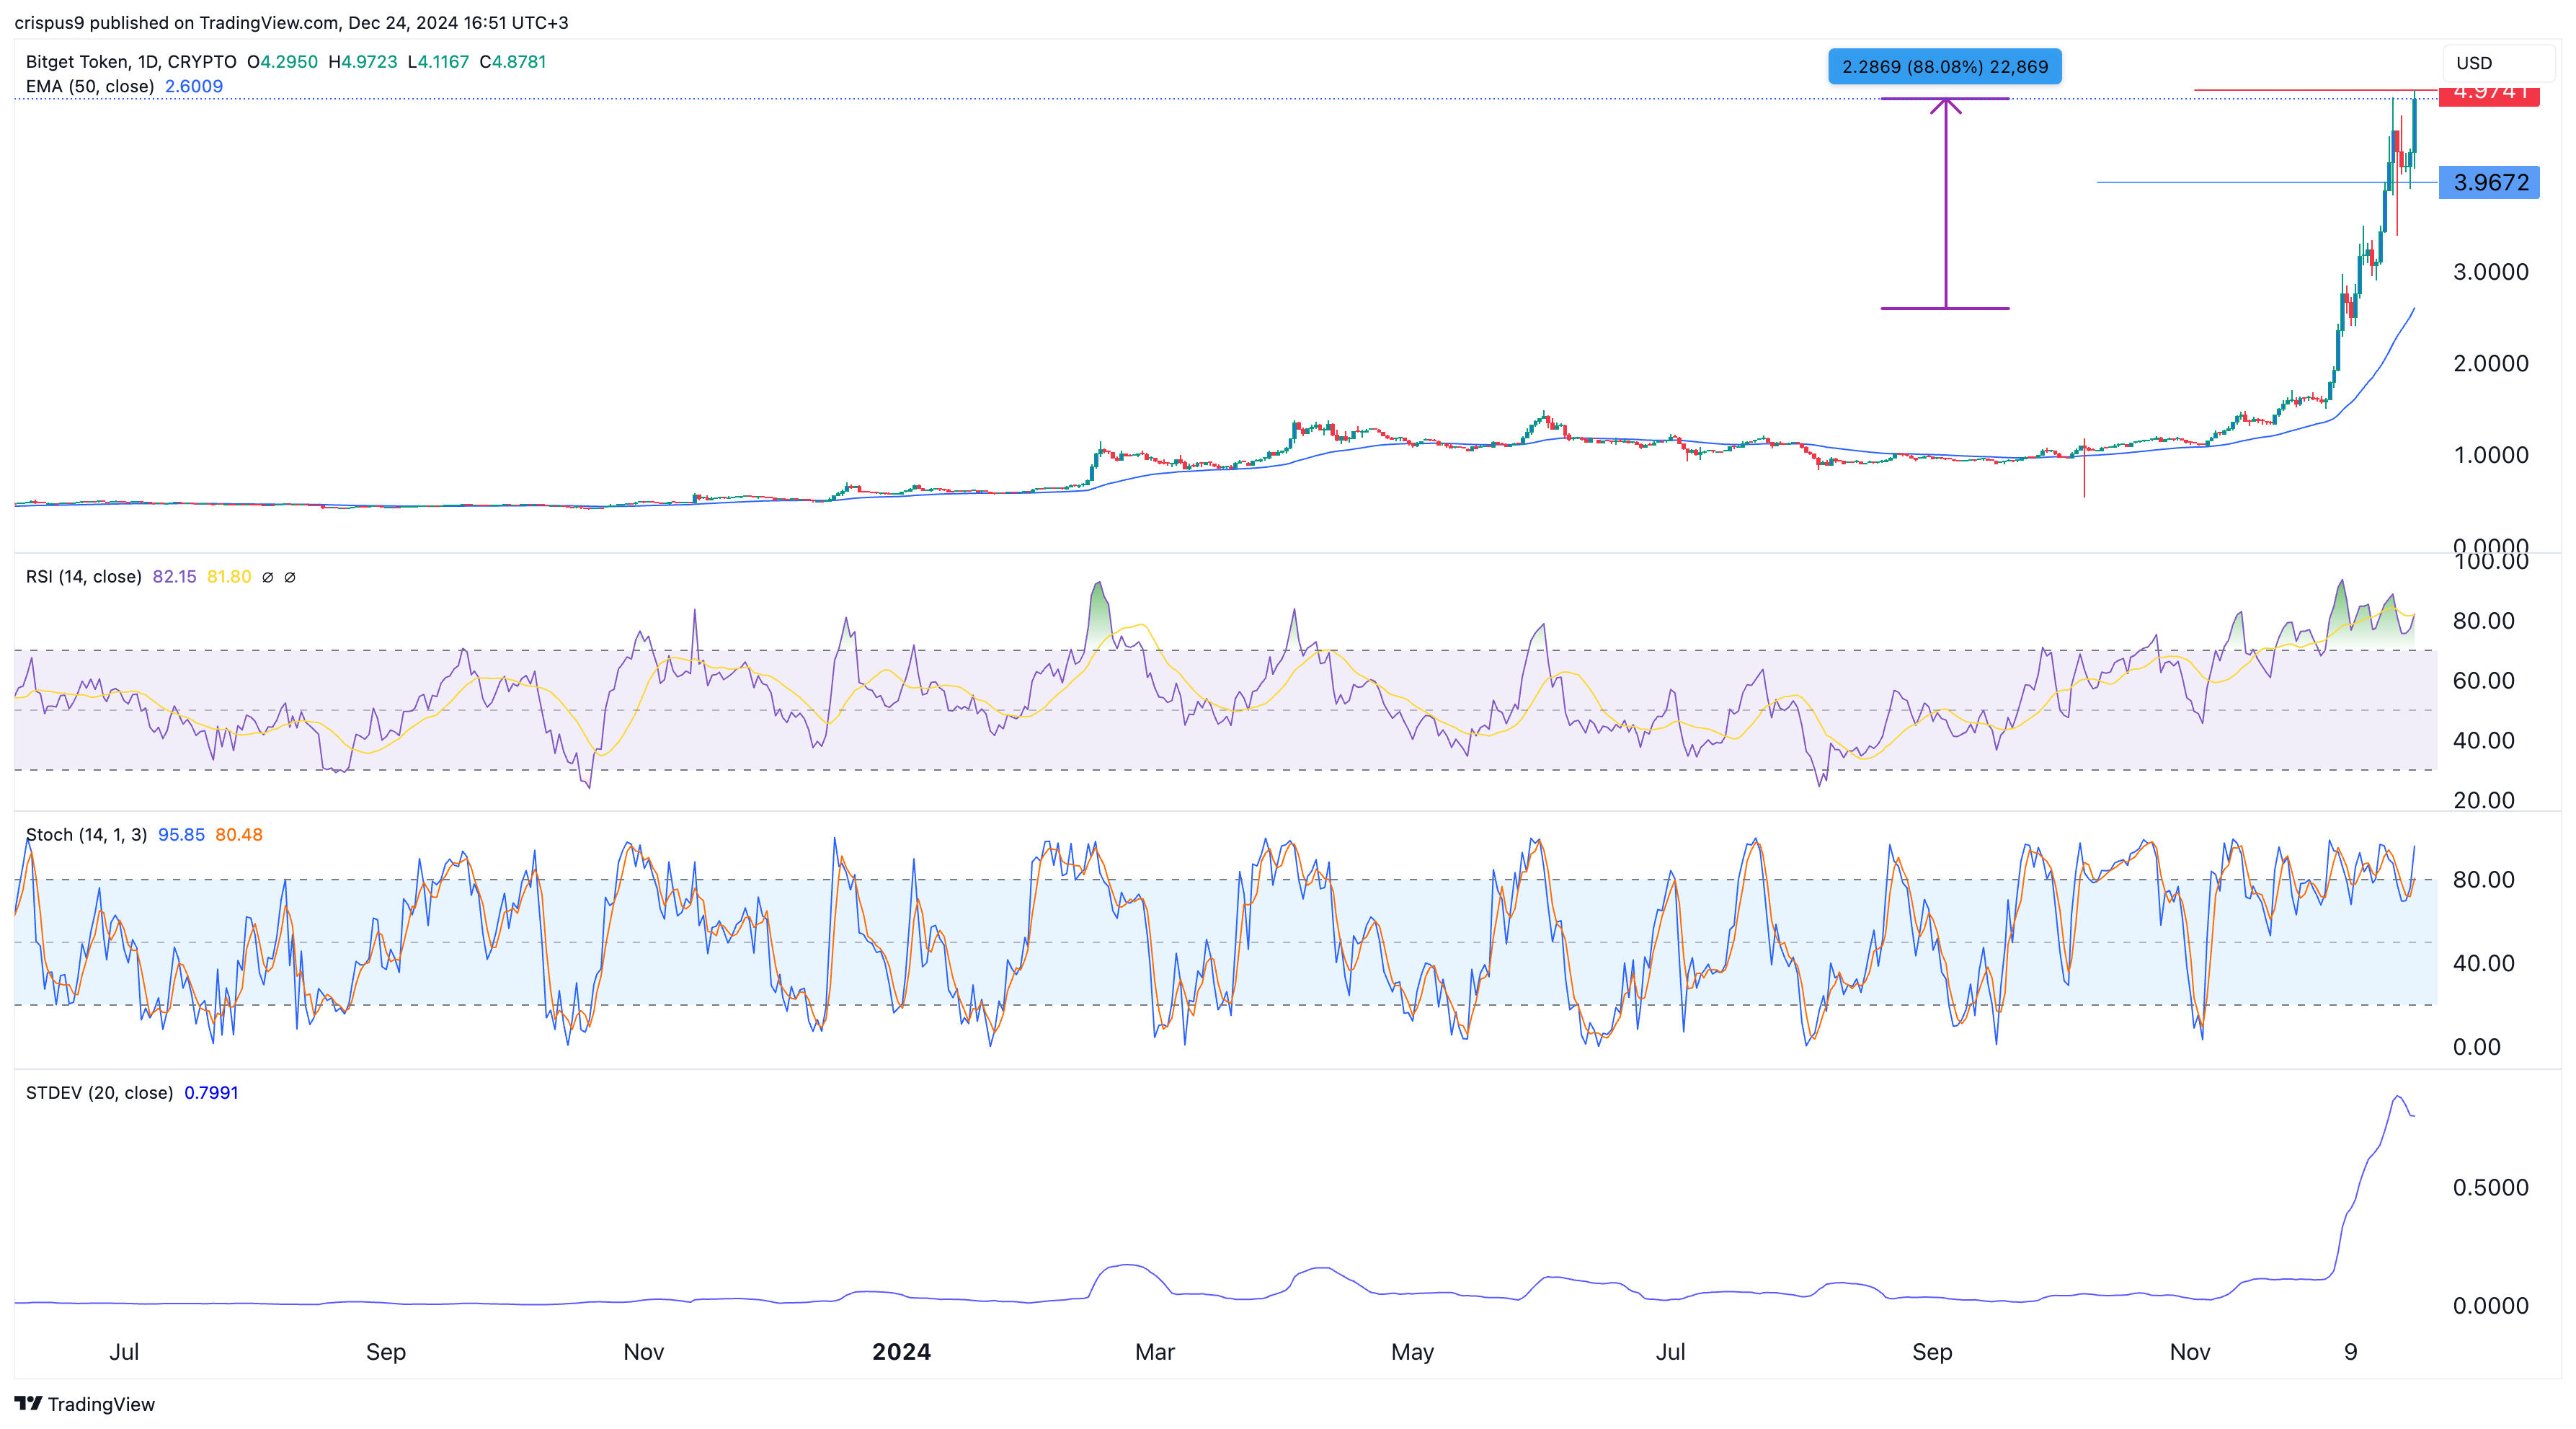
Meanwhile, the BGB price could retreat because the coin has become highly overbought. The Relative Strength Index has moved to the extreme overbought level of 82, while the two lines of the Stochastic Oscillator are nearing 100.
On top of this, it remains much higher than the 50-day and 100-day Exponential Moving Averages. It is about 88% higher than the 50-day MA, meaning that the concept of mean reversion could come in. This is a concept where an asset often drops to the moving average after deviating for so long. This is a notable thing since the standard deviation has jumped to the highest level this year.
Therefore, as we have seen with other popular coins that went parabolic, like Ripple and Stellar, there is a likelihood that they will suffer a harsh reversal soon as investors take profits.


