Ethereum price retreated on Boxing Day as the gains made during the Santa Claus rally were erased.
Ethereum (ETH) token fell to $3,340, down by over 5.6% from its highest level this week. This retreat happened as a sea of red spread in the crypto industry, with the market cap of all coins falling to $3.29 million.
Ethereum crashed in a low-volume environment as most traders remained away from the market during the Christmas holiday. CoinGecko data shows that the 24-hour volume was $17.5 billion, down from $24 billion a day earlier. It had its lowest volume in over a month.
Ethereum’s futures open interest also continued falling, reaching a low of $26 billion, down from this month’s high of $28 billion. Falling open interest is a sign of falling demand among futures traders.
Still, there are some positive signs in the Ethereum market. Data by DeFi Llama shows that the total value locked in its DeFi ecosystem has risen by 5.50% in the last 30 days. Solana and Tron’s TVL has dropped by over 3% in that period.
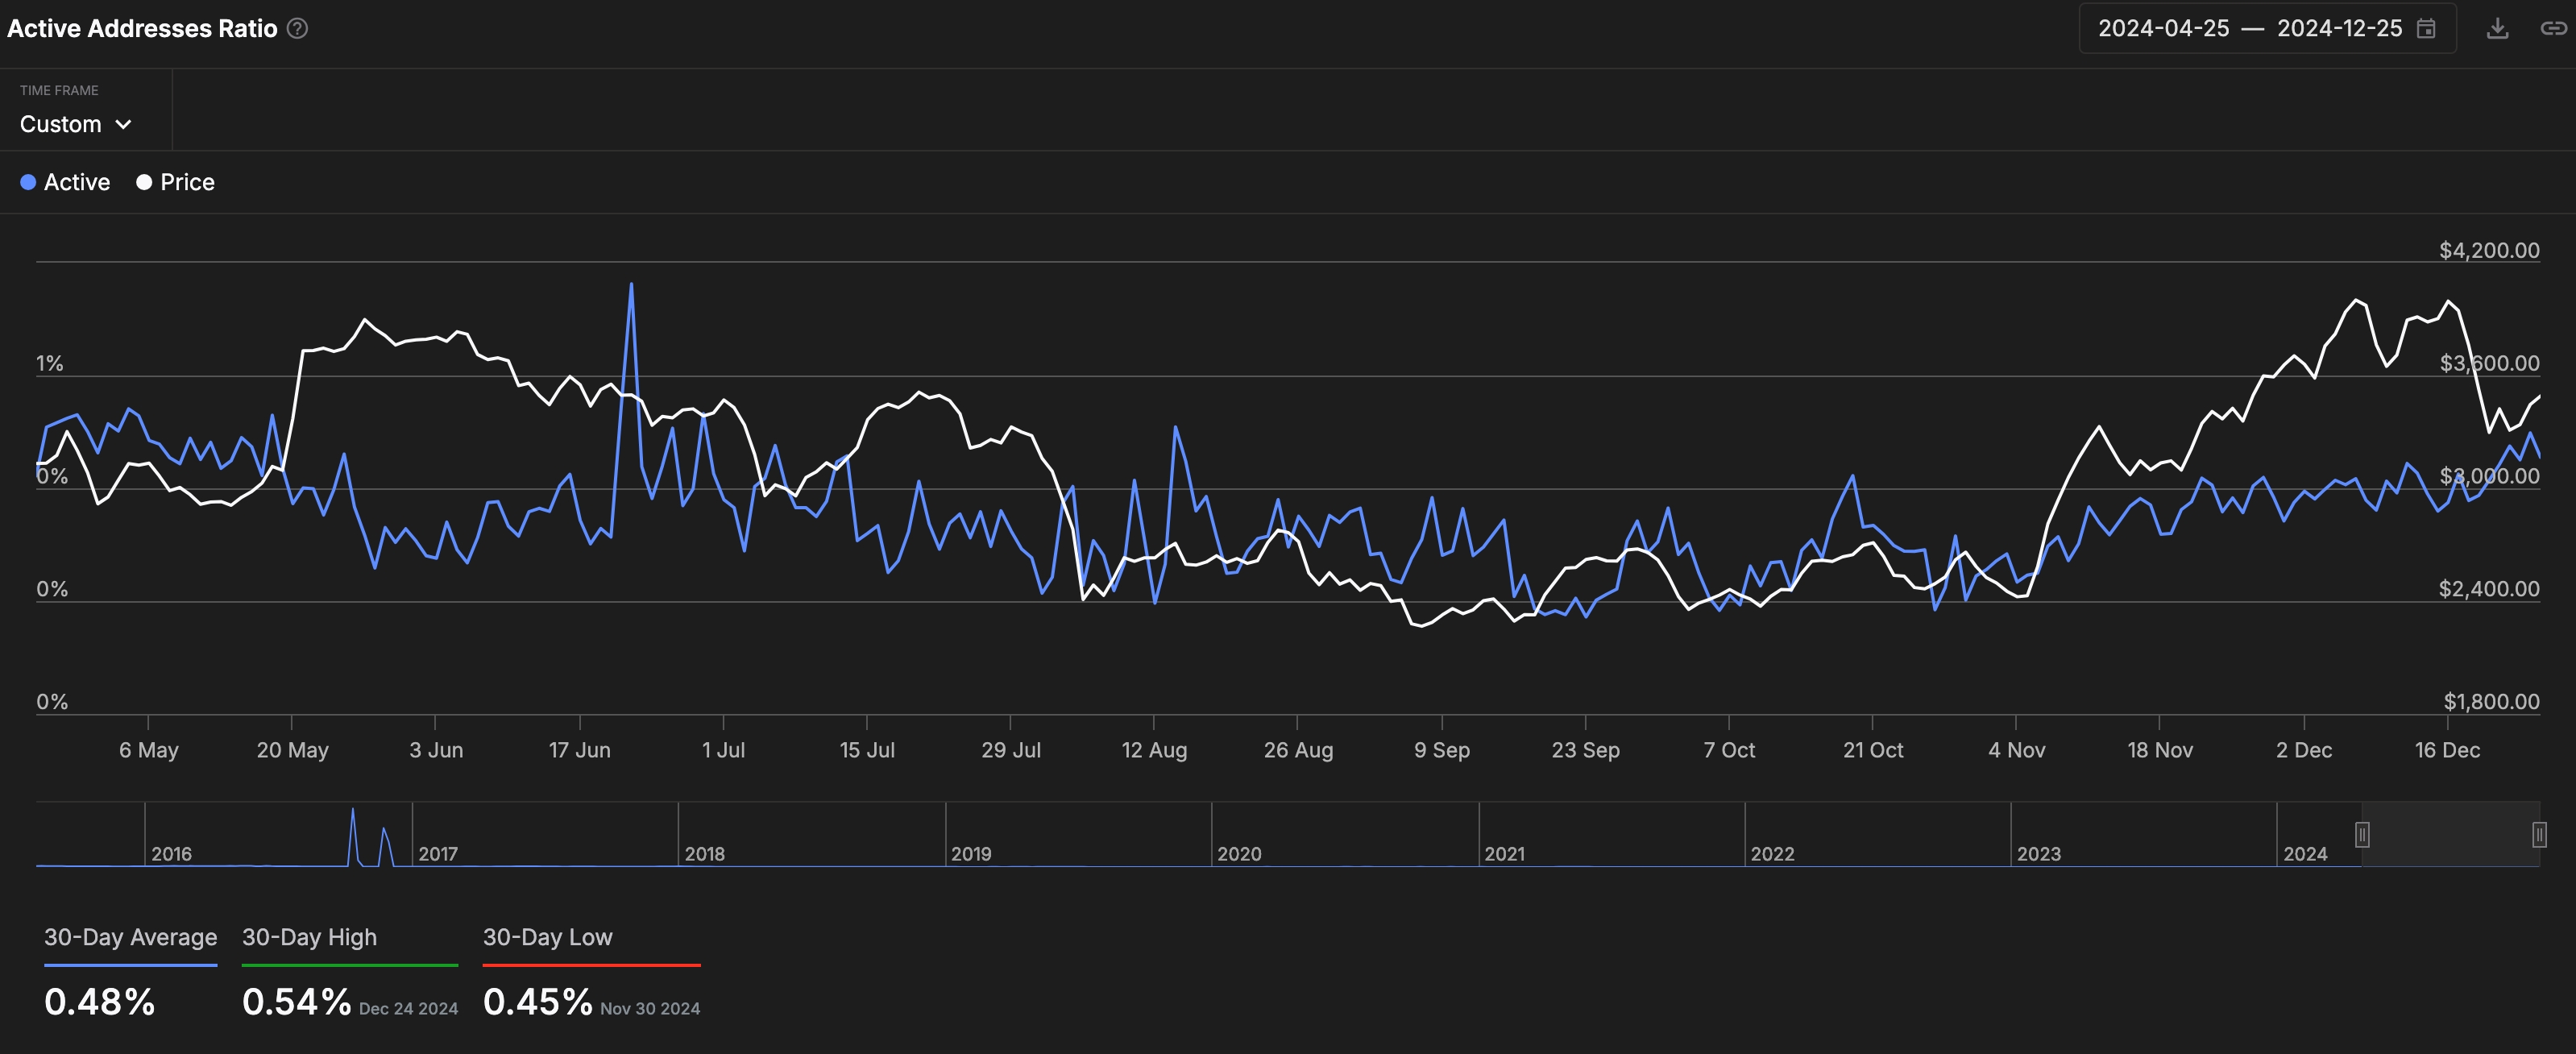
The active addresses ratio has continued to rise in the past few months. It has risen from the October low of 0.37% to 0.57%, its highest level since August. This important data point looks at the ratio of active addresses to balances with balances. Total active Ethereum addresses have risen to over 927,000.

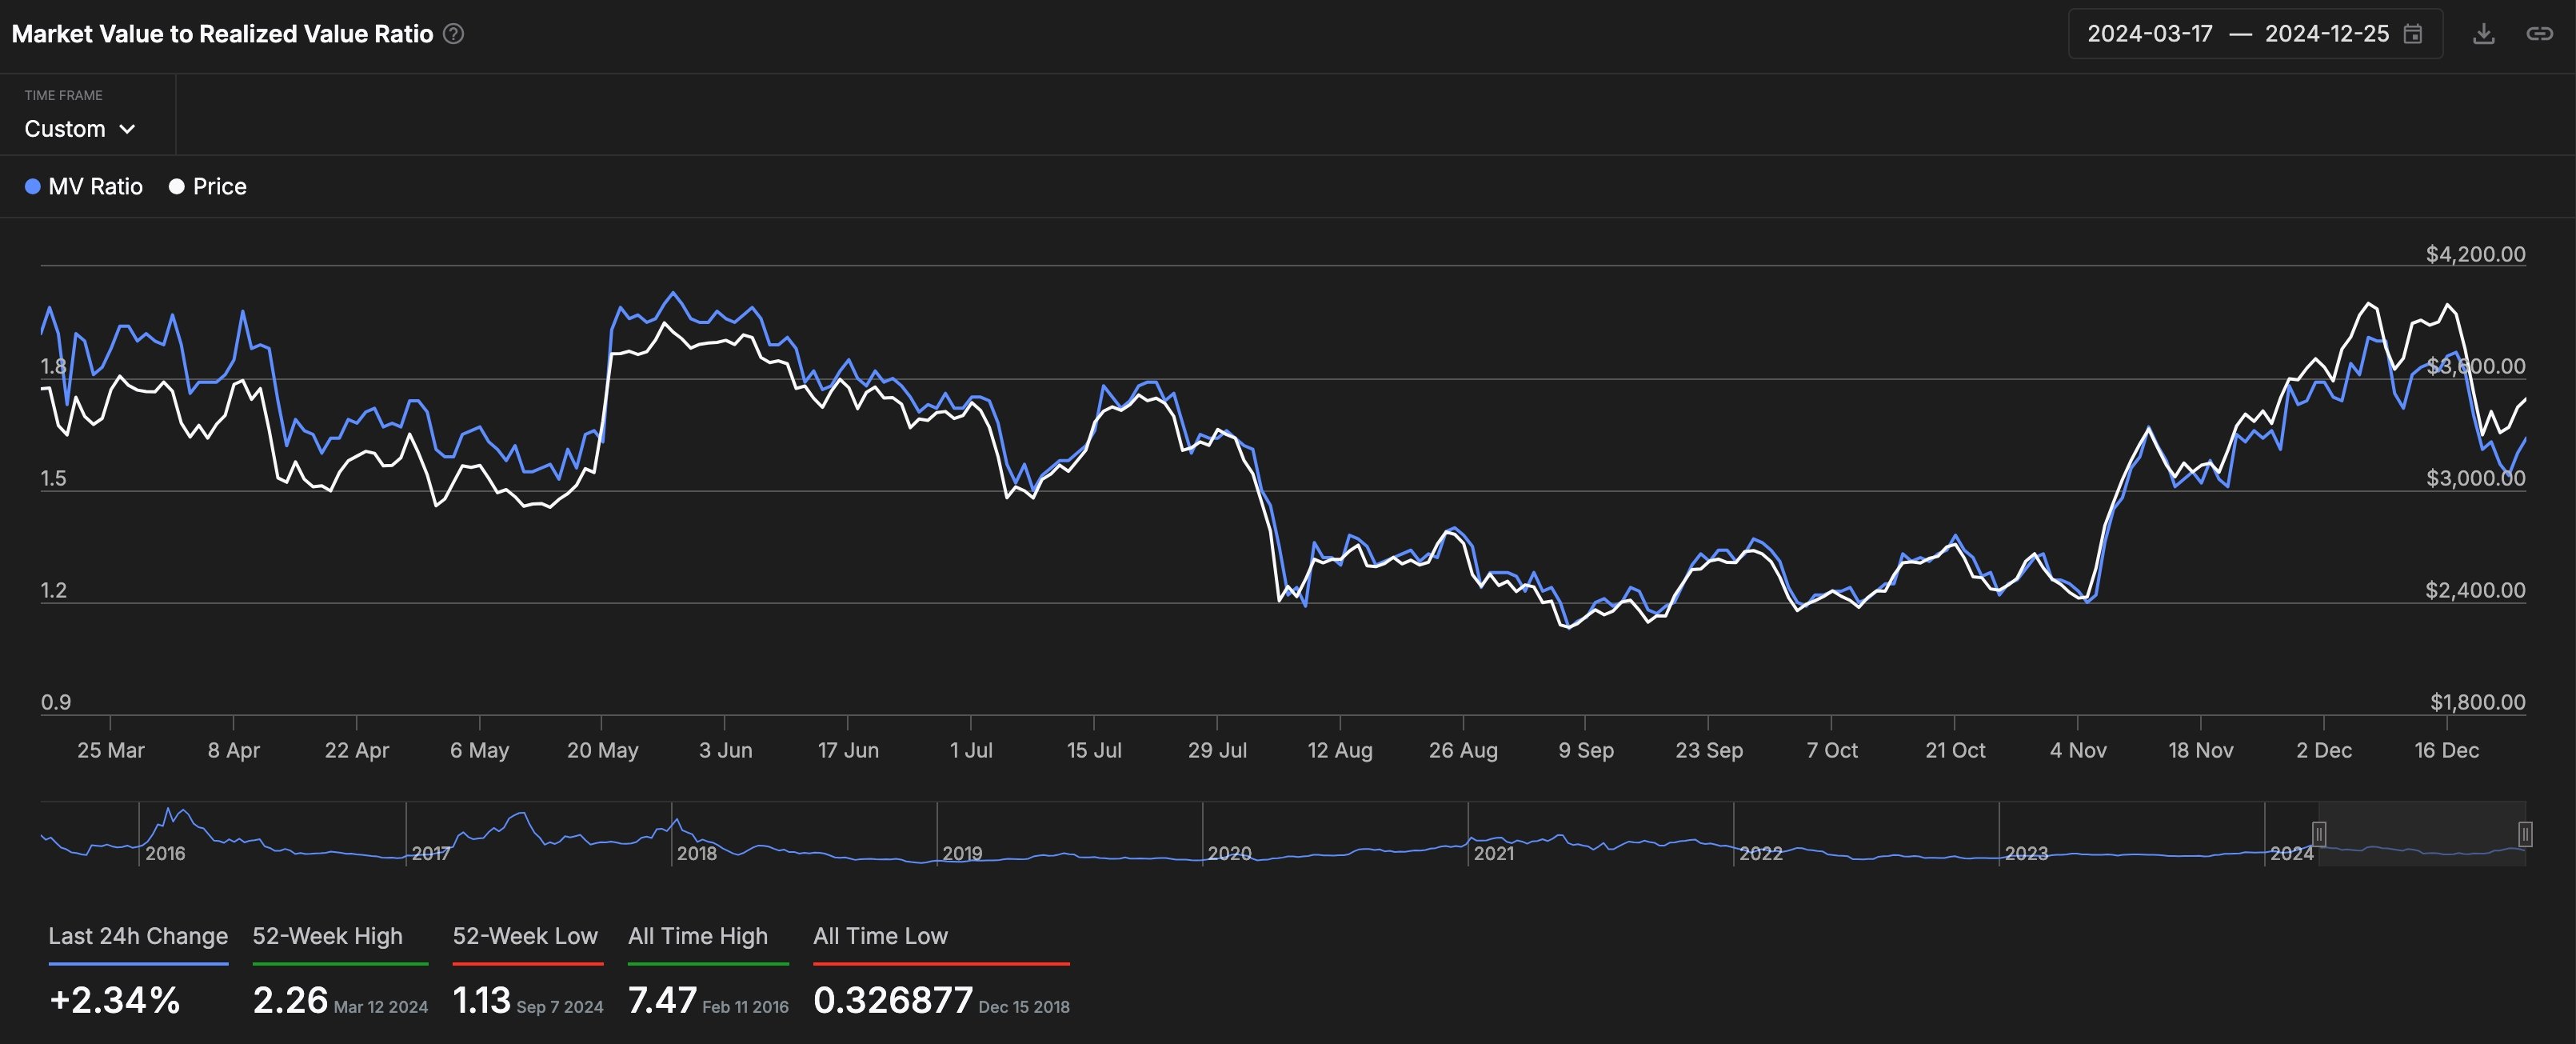
More technical data shows that Ethereum’s Market Value to Realized Value score rose by 2.35% in the last 24 hours to 1.64. This important number looks at whether a crypto asset is overvalued or undervalued. An MVRVA figure of less than 3.8 indicates that an asset is relatively undervalued.

Ethereum price analysis

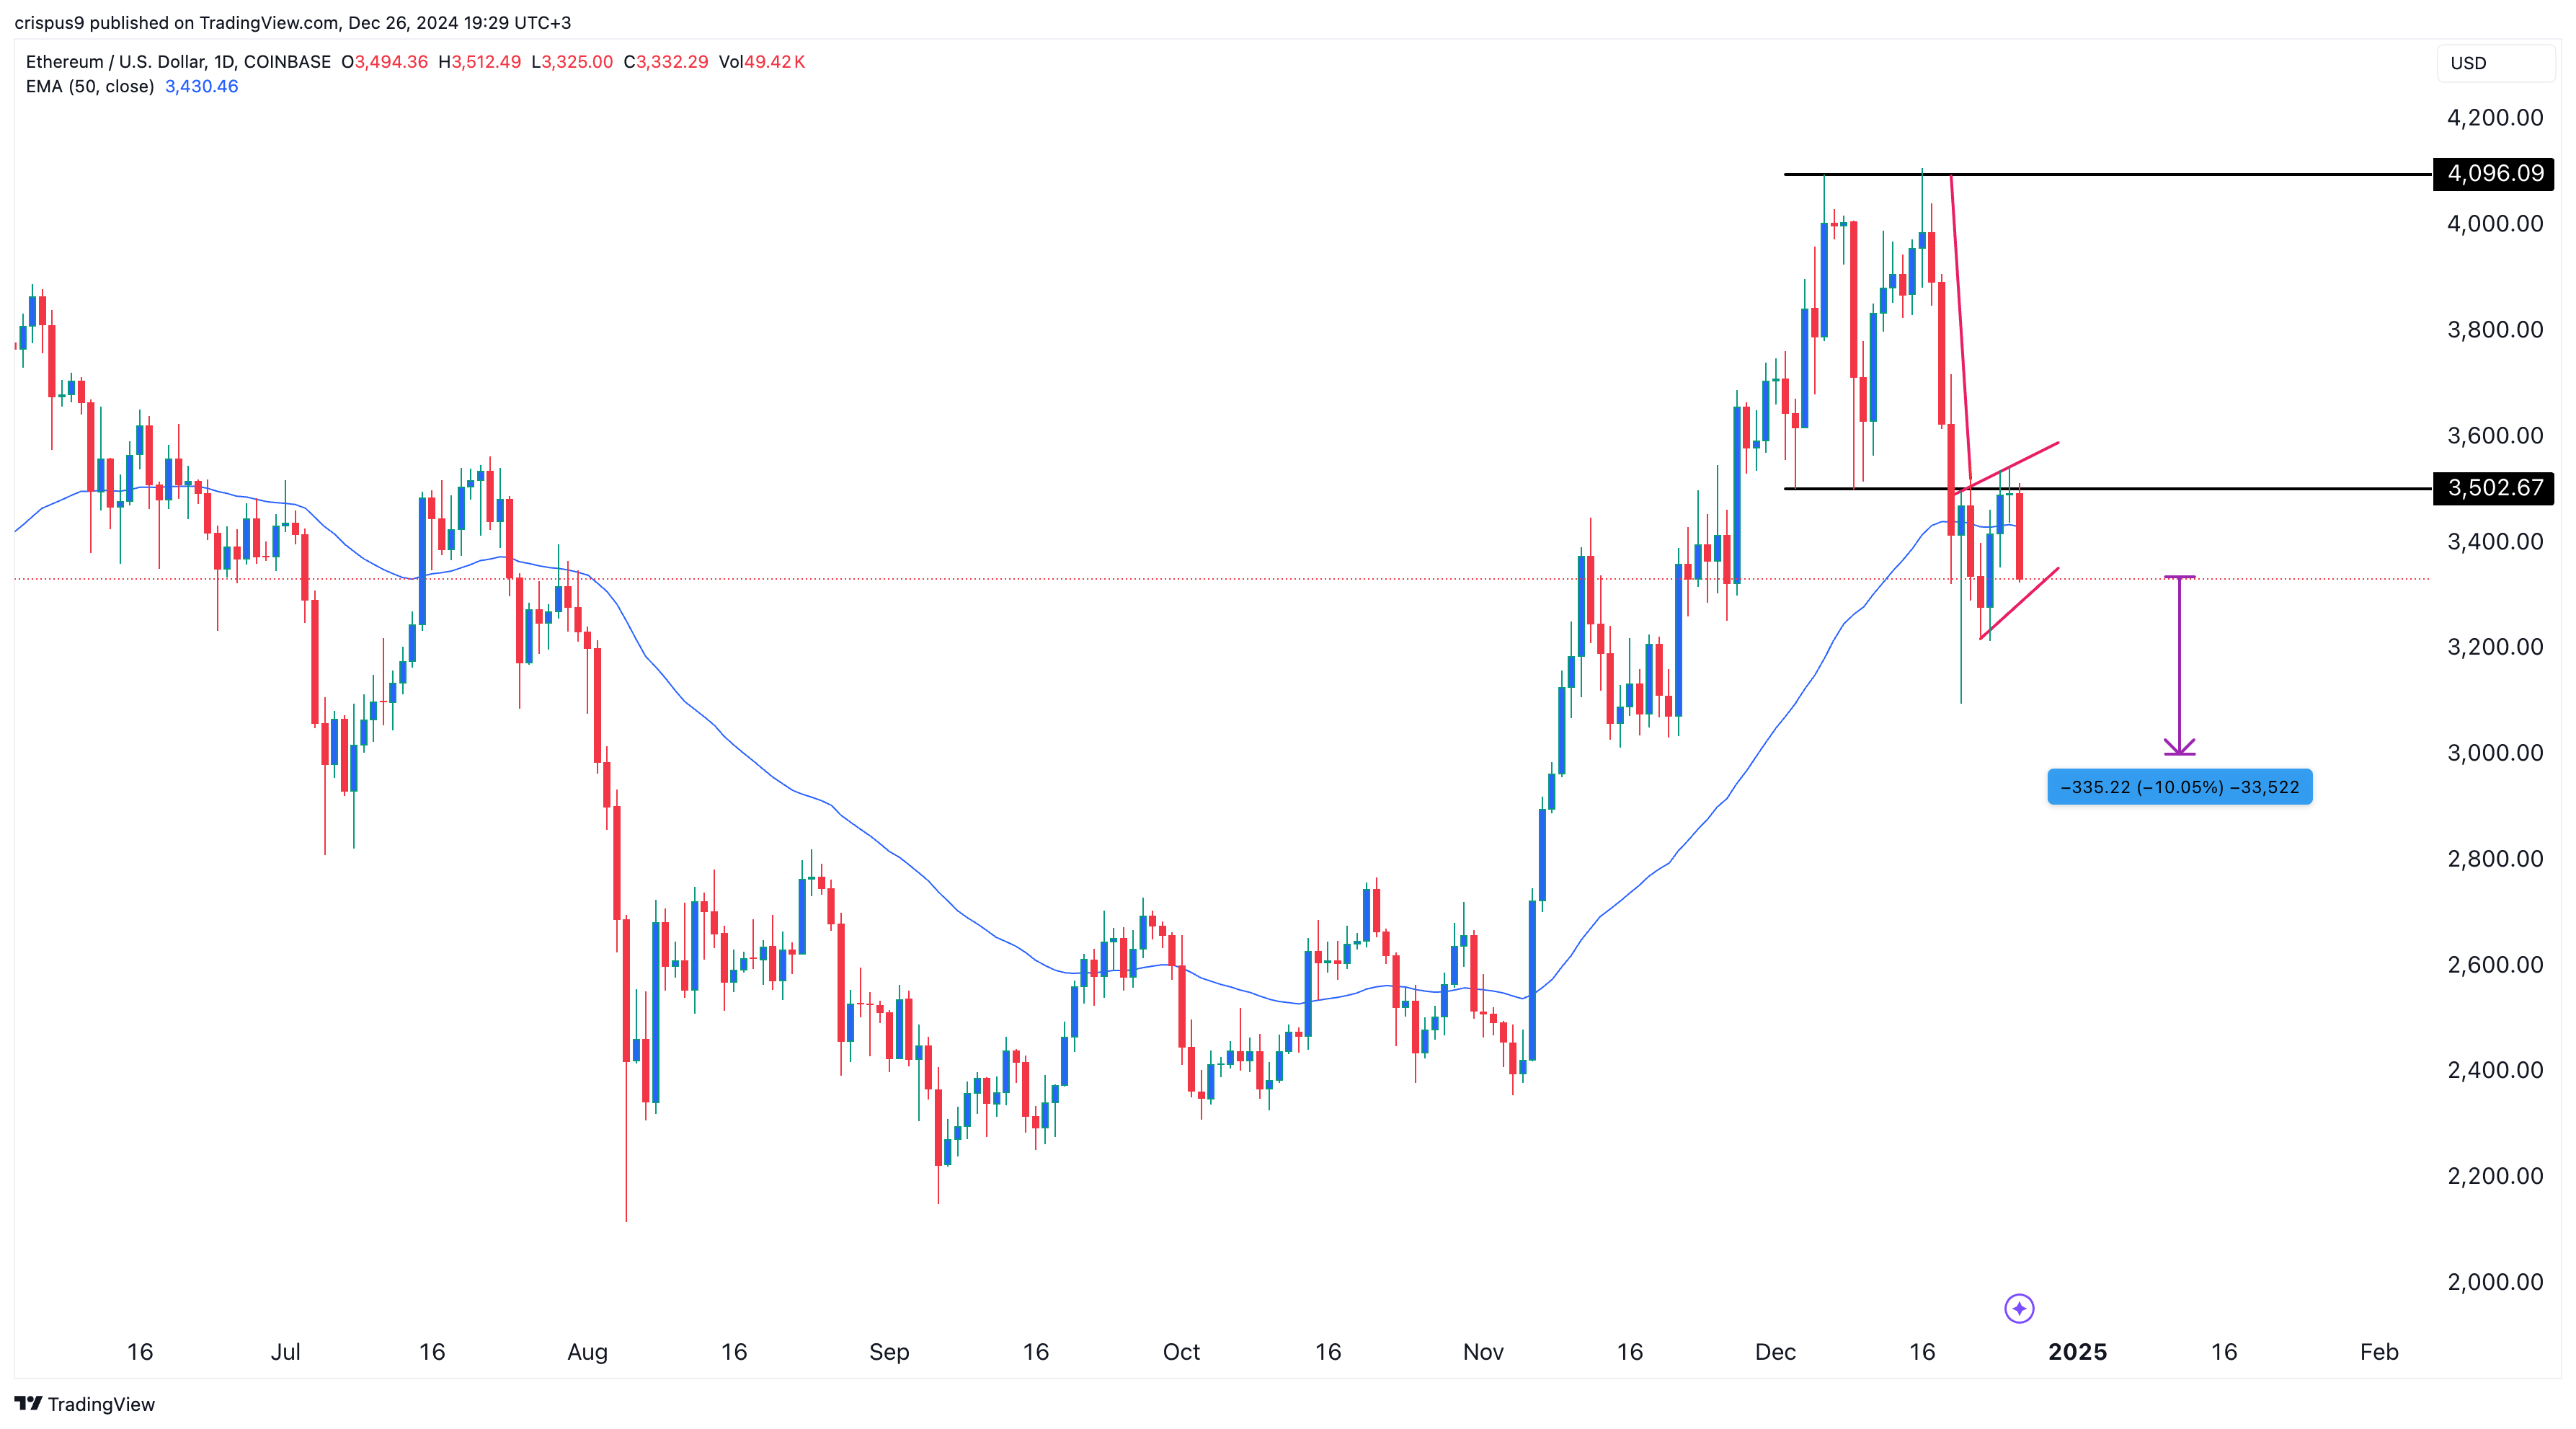
The daily chart shows that the ETH price formed a small double-top pattern at $4,095 and then made a strong bearish breakout. It then rebounded and retested the pattern’s neckline at $3,500, its lowest swing on December 3.
ETH formed a small doji candlestick pattern on Christmas day. A doji is made up of a small body and long and upper shadows and is usually a bearish sign. Ethereum has also formed a bearish flag chart pattern.
Therefore, the coin will likely have a bearish breakout and reach the psychological point at $3,000, down by 10% below the current level.
Disclosure: This article does not represent investment advice. The content and materials featured on this page are for educational purposes only.


