Bitcoin price has moved into a technical correction and found support at the 50-day moving average.
Bitcoin (BTC) retreated to $94,830, down by over 12% from its highest level this month as the Santa Claus rally failed to materialize.
The retreat happened in a low-volume environment, as many investors and traders remained in the Christmas season mode.
According to CoinGecko, Bitcoin’s volume of $22 billion on Sunday, Dec. 29 was down from $41 billion a day earlier. Its volume on Friday was $45 billion, higher than $33 billion on Thursday. Bitcoin tends to have daily volume of over $100 billion in normal market conditions.
Bitcoin lost its momentum after the Federal Reserve delivered a highly hawkish monetary policy meeting earlier this month. It slashed interest rates by 0.25%, while its dot plot pointed to just two cuts. The Fed had hinted that it would deliver as many as four cuts in 2025.
Bitcoin has also struggled as doubts about a Strategic Bitcoin Reserve fell and ETF inflows retreated. Polymarket odds of Donald Trump creating these reserves in the first 100 days have dropped to 29%, down from the November high of 60%.
Meanwhile, ETF inflows have been sluggish in the past few days. Data by SoSoValue shows that Bitcoin ETFs have shed assets in 6 of the last seven market days. These funds have accumulated net assets of $35.6 billion since inception.
Will BTC have a January effect?
The so-called Santa Claus rally, where assets rally ahead of Dec. 25, did not come to fruition. Therefore, Bitcoin investors hope that it will achieve a so-called January effect — a theory that suggests most financial assets (i.e., stocks and crypto) rally in the first month of the year as participants create their portfolios.
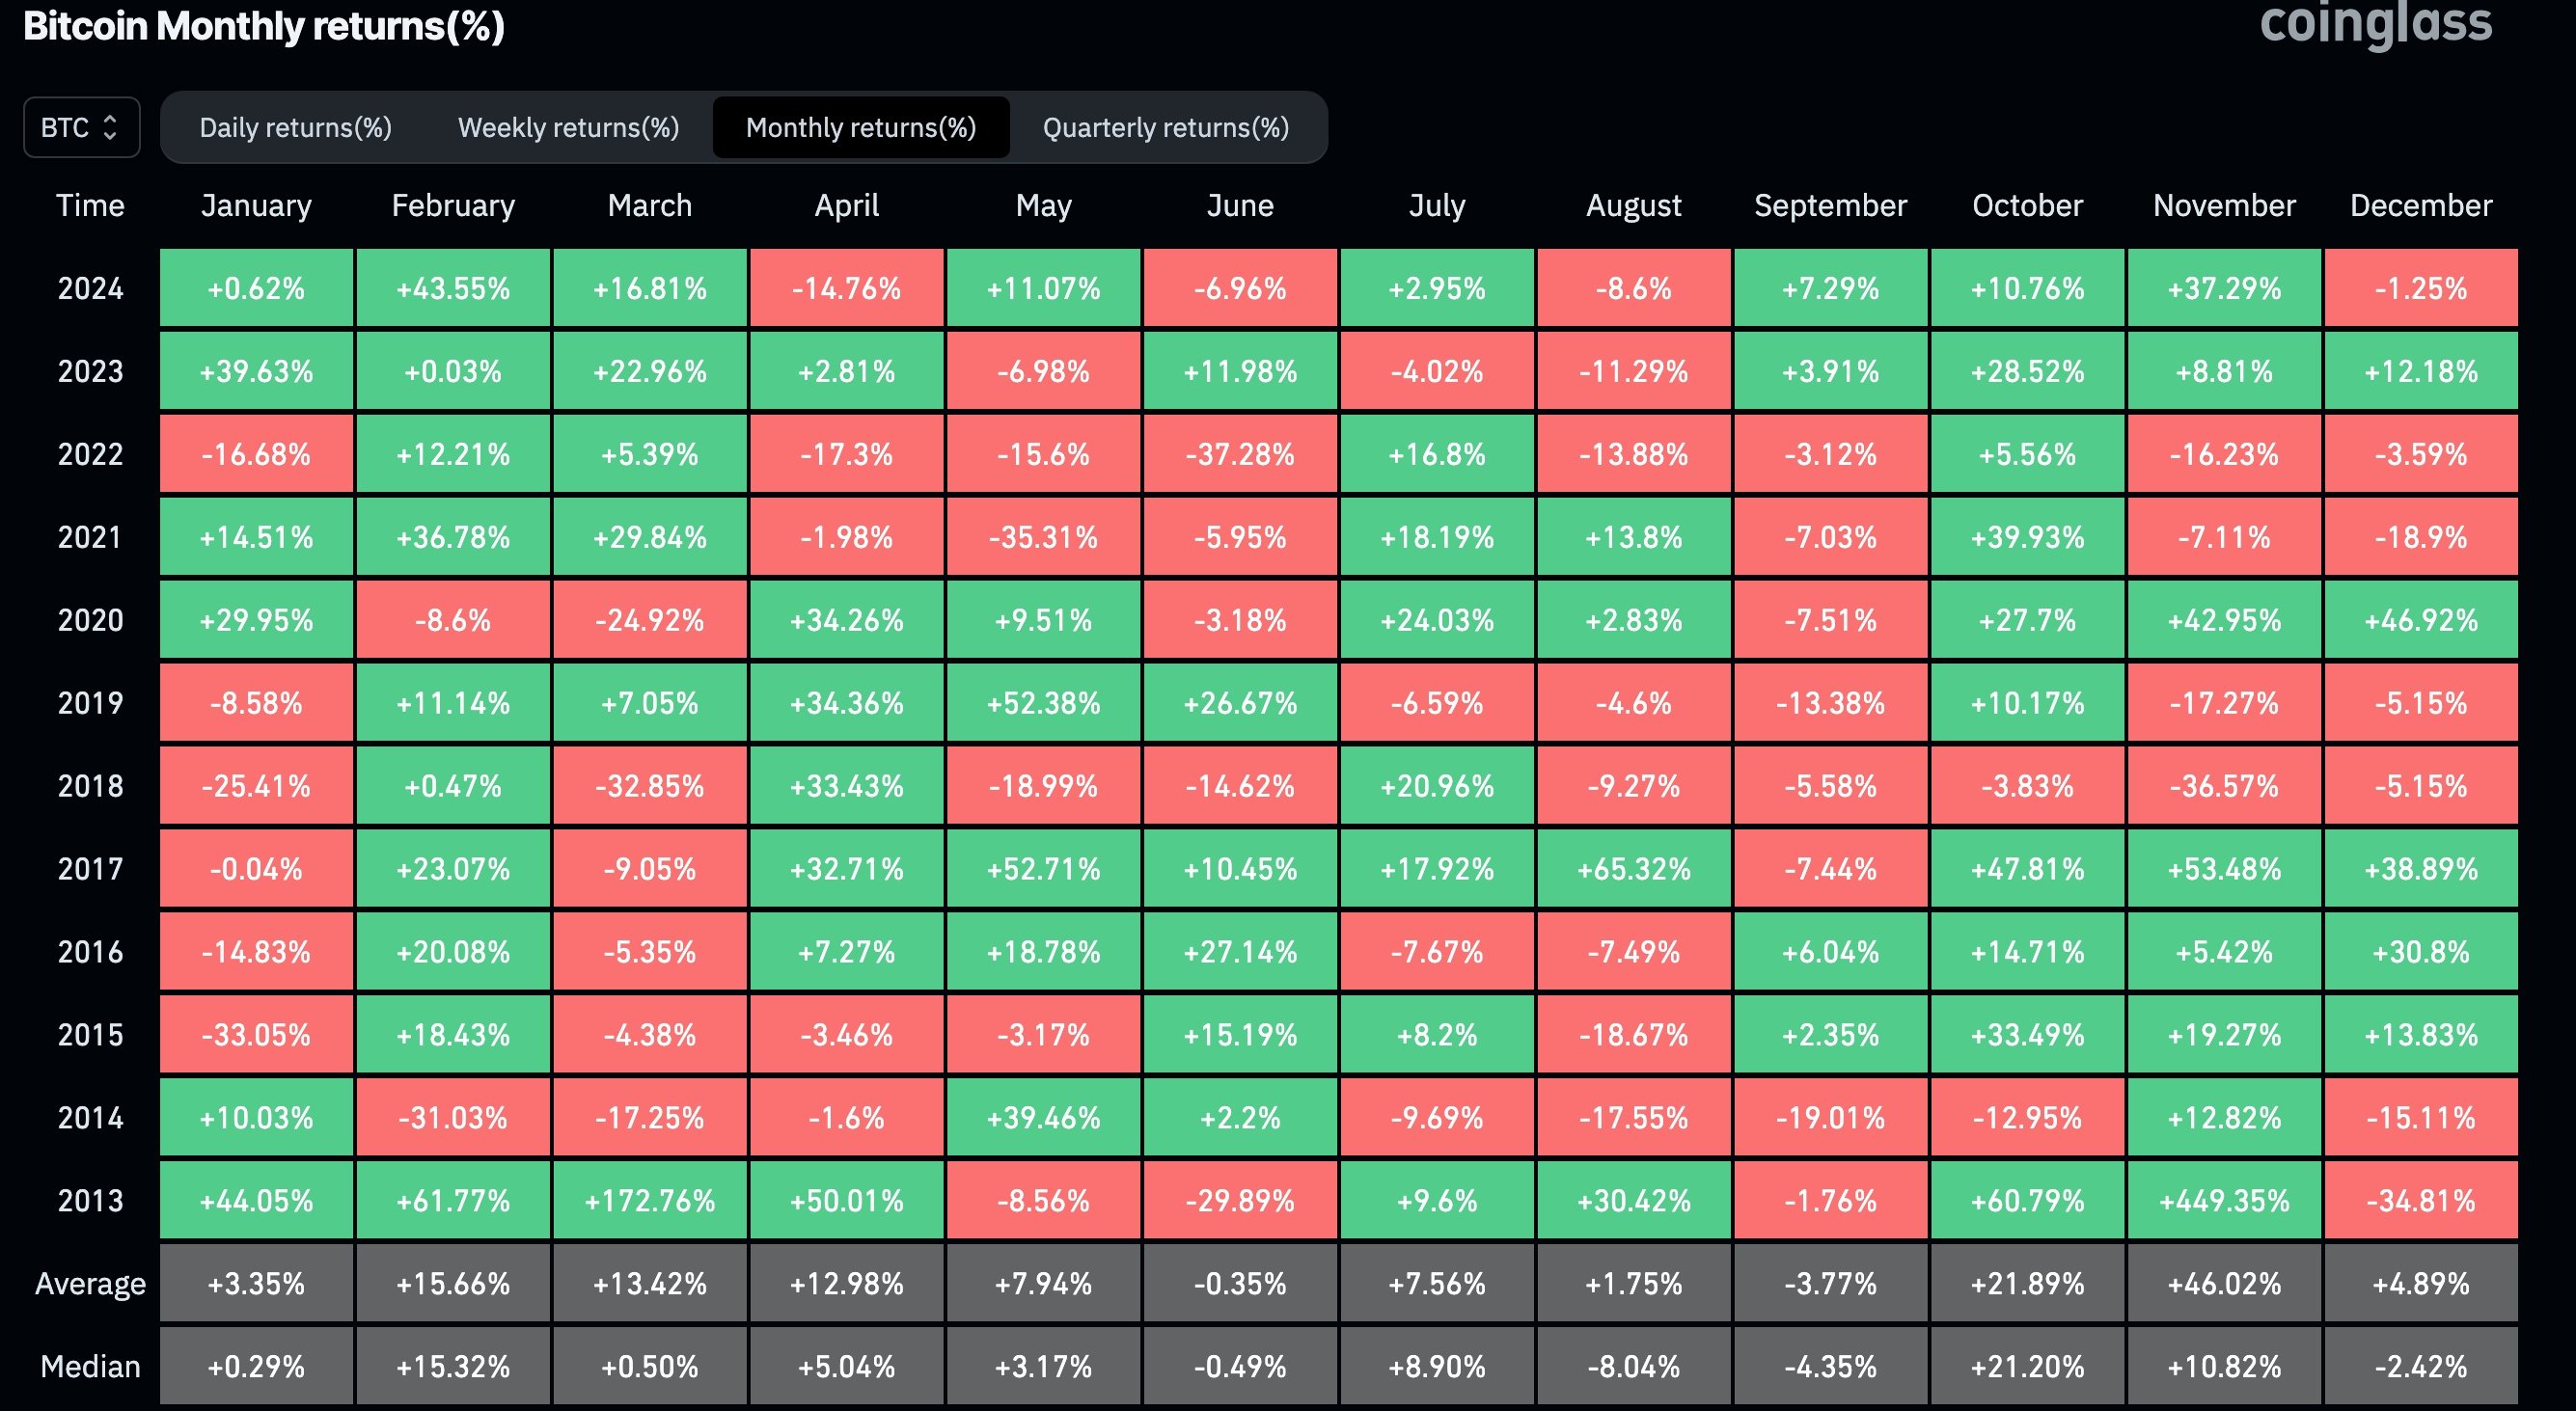
History suggests that Bitcoin does not necessarily have strong gains in January. As shown below, BTC was positive six times since 2023. It rose by just 0.62% in this year’s January and 39% a year earlier.
February is usually a strong month for Bitcoin; it moved in the red just two times.

Bitcoin price is at a crucial support
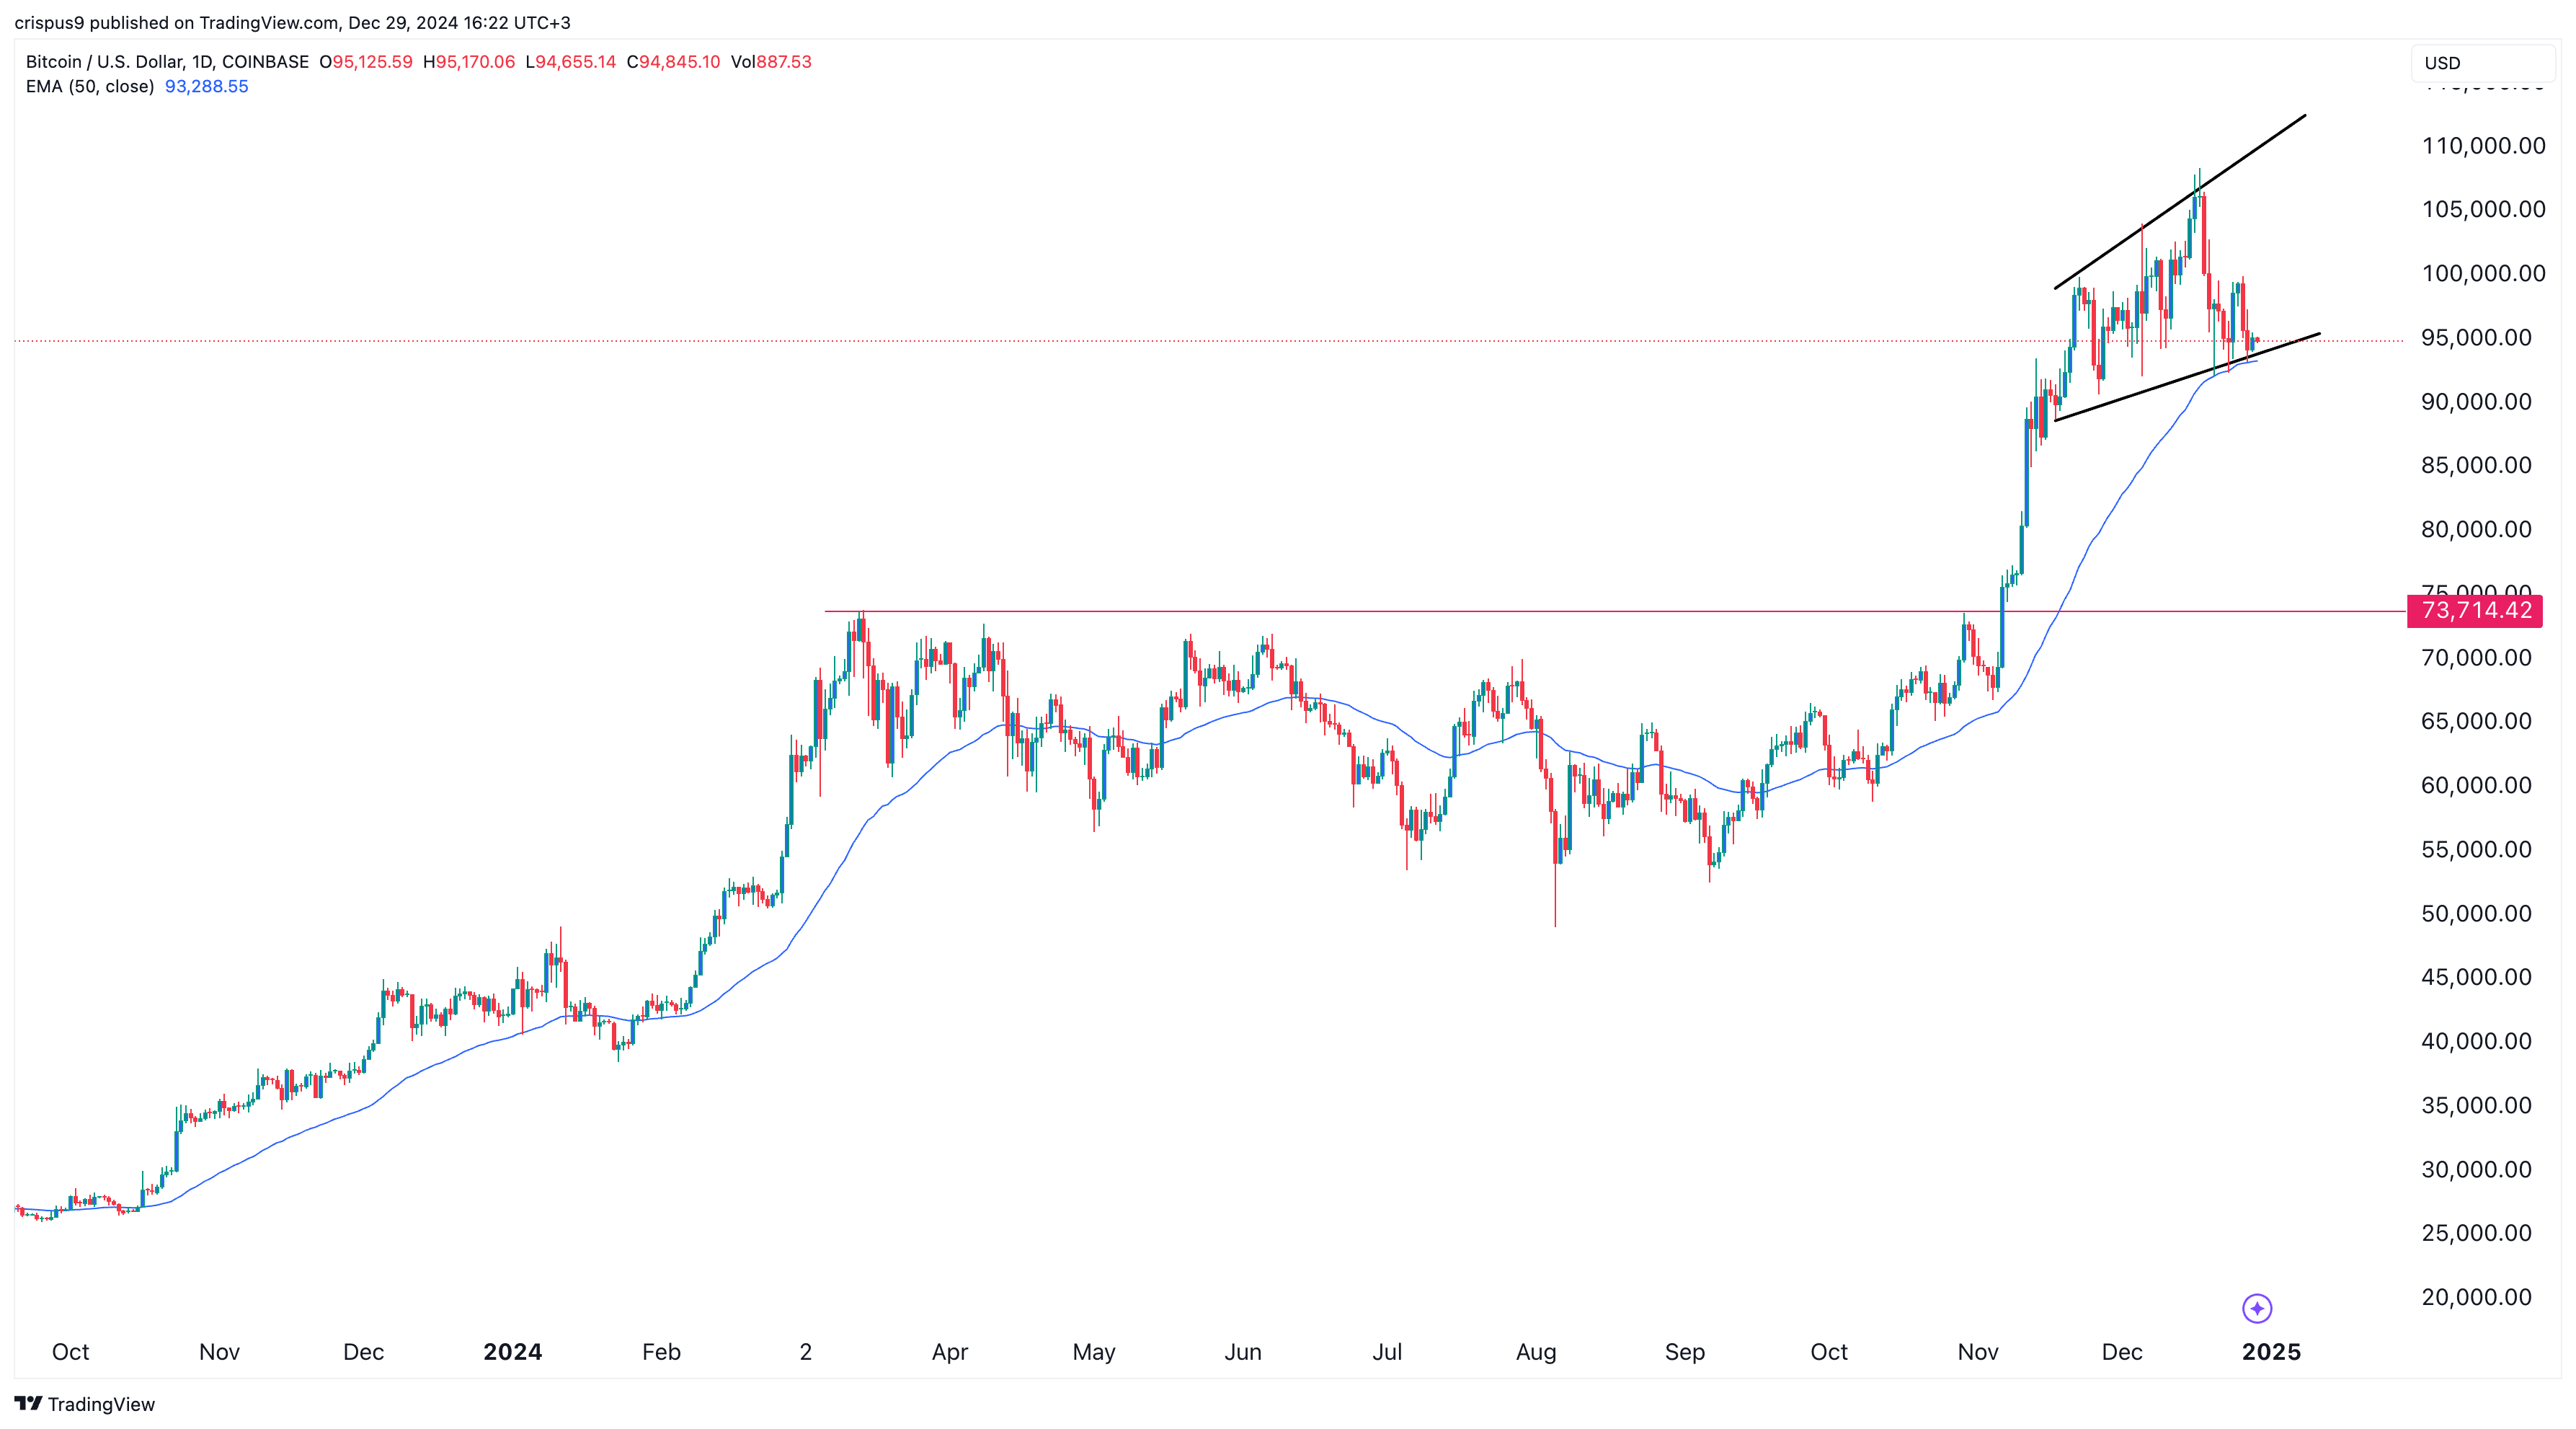
The daily chart shows that Bitcoin is at a crucial support level, which could point to more gains in the coming weeks. It has found support at the 50-day moving average. Also, the coin has failed to move below the ascending trendline that connects the lowest swings since Nov. 17.
The risk, however, is that the coin has formed a rising broadening wedge pattern, a popular bearish sign. Therefore, a drop below its lower side may point to more downside, potentially to $73,777, its March high.

The alternative scenario is where Bitcoin price rebounds and retests the upper side of the wedge at $110,000.


