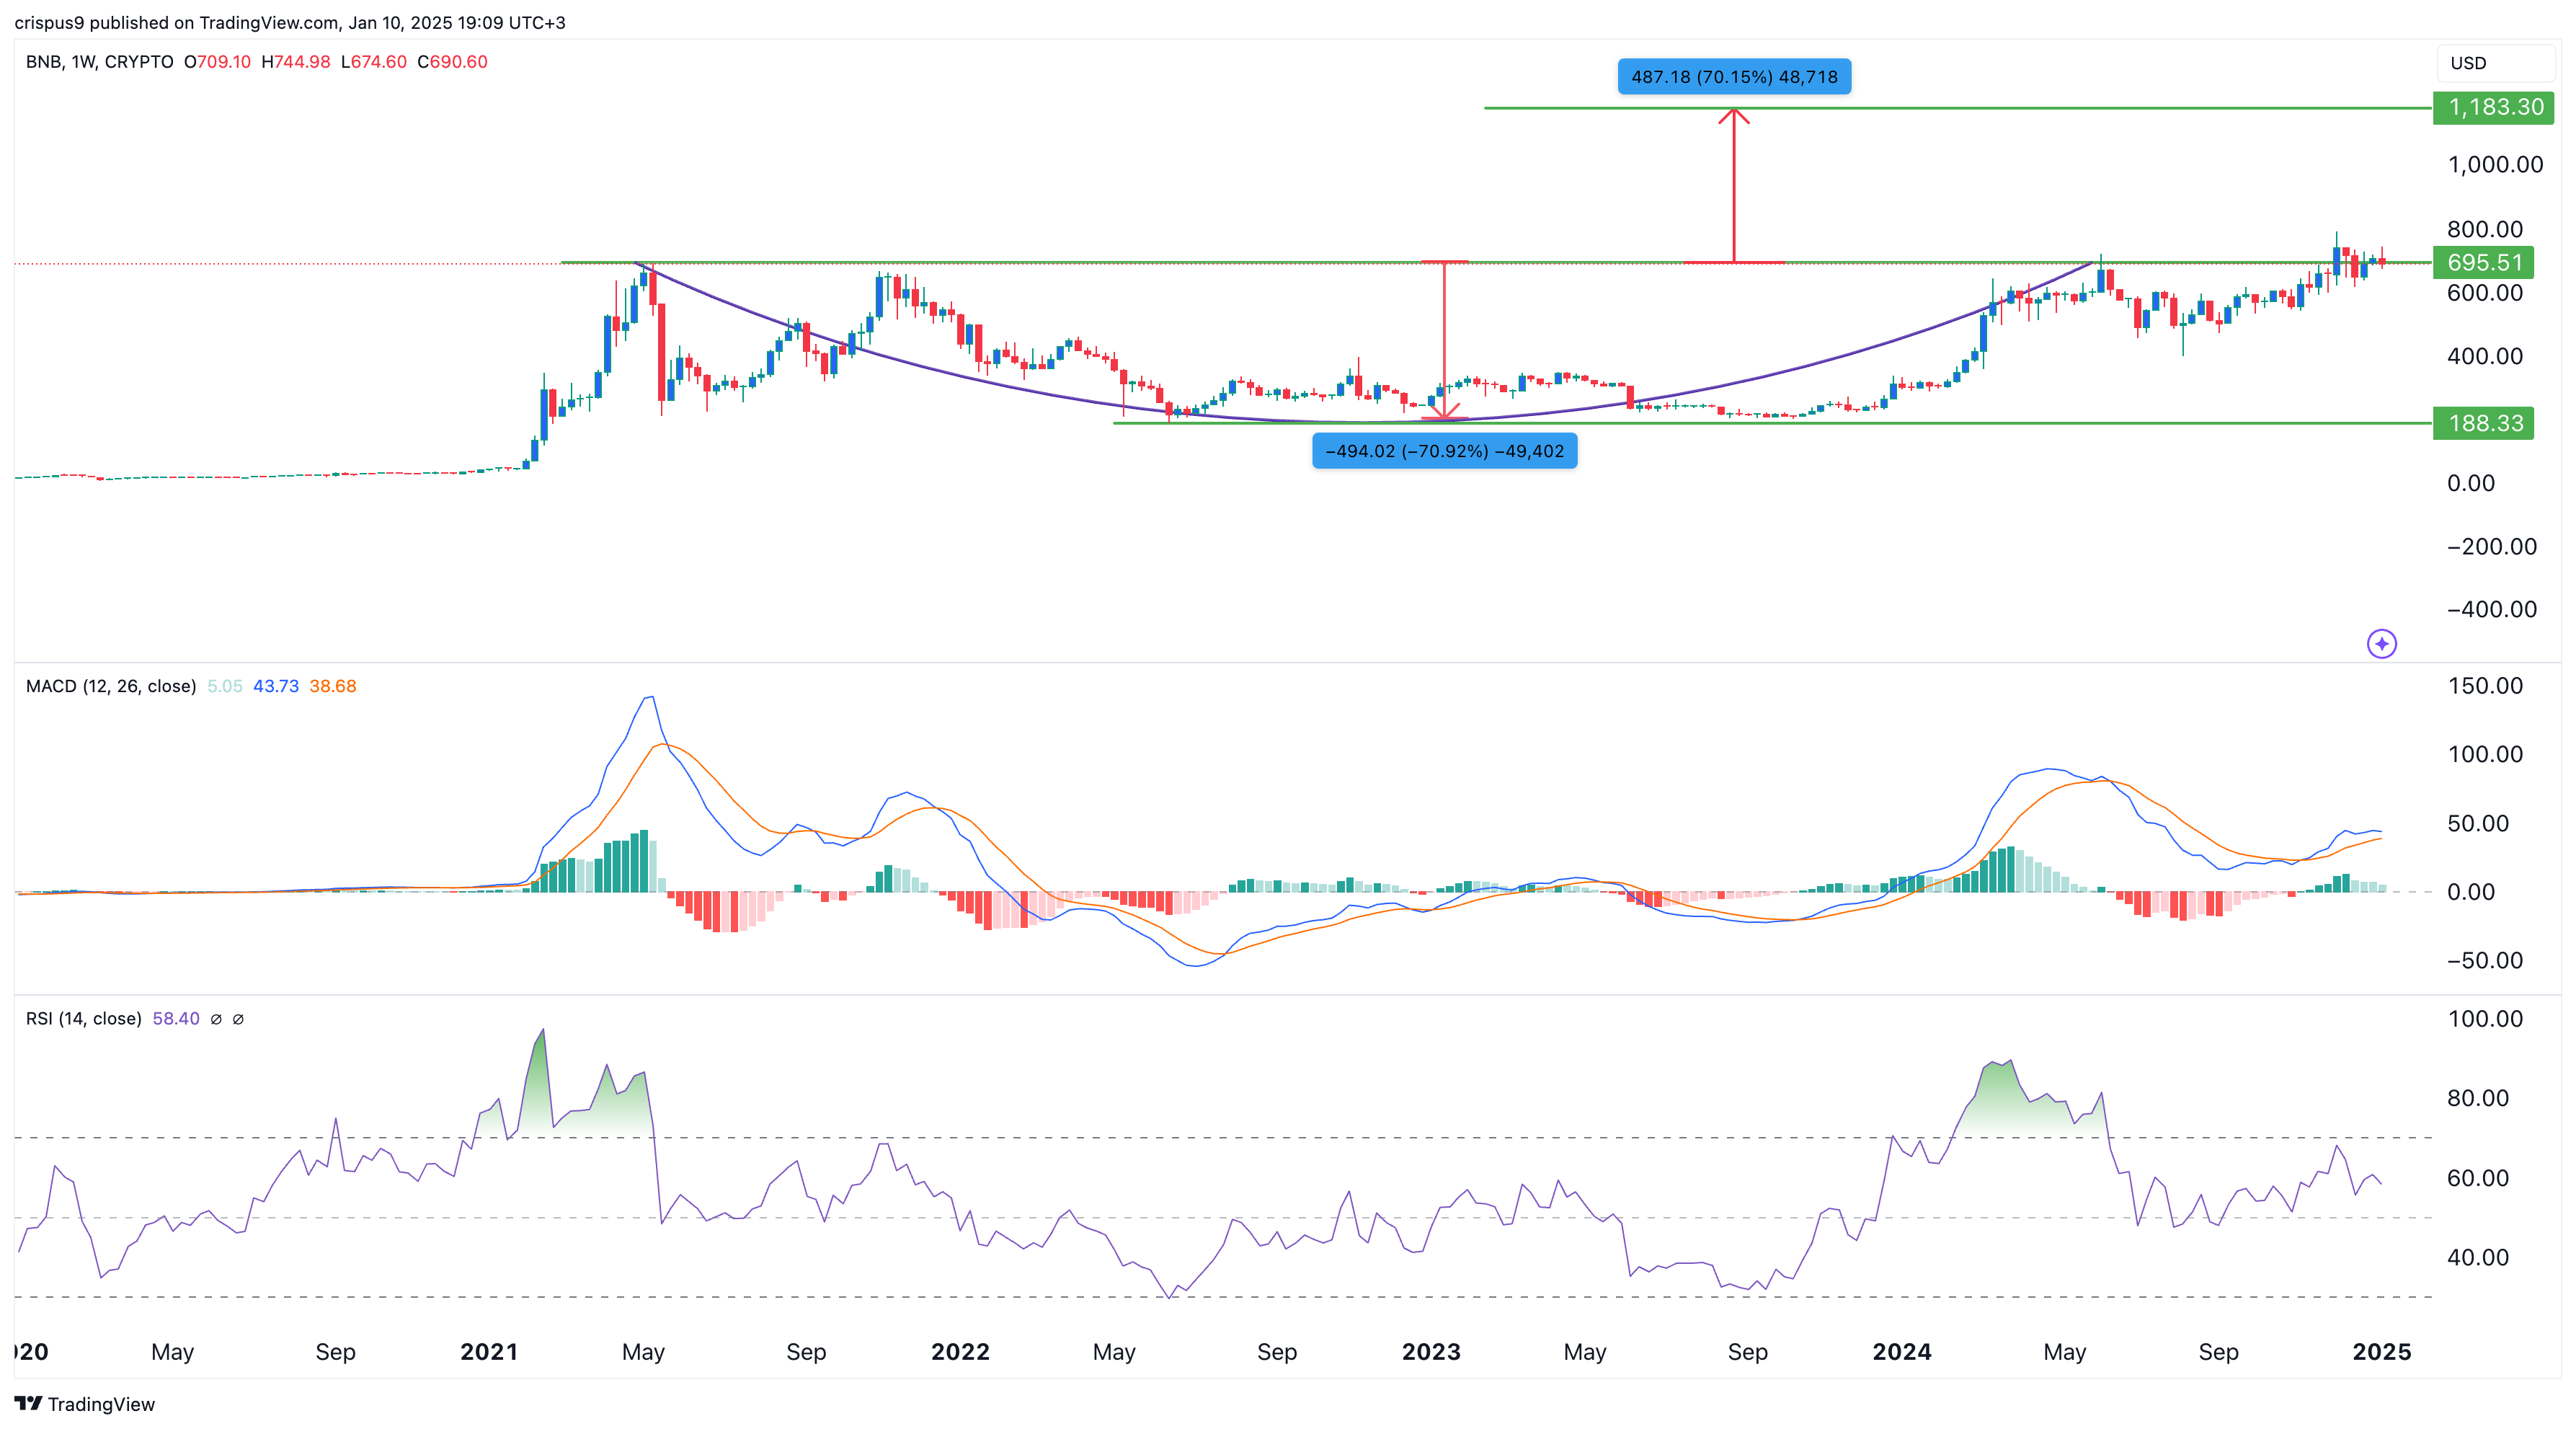
Binance Coin, the fifth-largest cryptocurrency by market capitalization, has largely avoided the ongoing crypto crash and is hovering near its all-time high.
Binance Coin (BNB) was trading at $695 on Friday, just 12% below its record high reached in December. In comparison, Bitcoin (BTC) has fallen by 15%, while other mega cap cryptocurrencies like Solana (SOL) and others have all declined by over 20%.
BNB’s resilience is primarily due to its lower correlation with Bitcoin and other cryptocurrencies. According to data from Blockchaincenter, BNB’s 90-day correlation coefficient with Bitcoin stands at 0.65, lower than that of many other major coins.
BNB’s price action is also influenced by its substantial quarterly token burns, which reduce the supply of coins in circulation. Binance employs two types of burning mechanisms: real-time and quarterly burns.
Real-time burns happen where a fixed ratio of gas fee collected is burned in each block. This burn mechanism has incinerated BNB tokens worth $171 million.
The quarterly burn is based on the number of blocks produced within each quarter. In the fourth quarter, 1.63 million BNB tokens worth $1.02 billion were burned. According to data from BNB Burn, the upcoming quarterly autoburn is expected to incinerate an additional 1.55 million tokens, valued at around $1.09 billion.
The BSC ecosystem has also continued to do well in the past few months. For example, the ecosystem’s total value locked (TVL) has grown by 3% in the last 30 days, while Ethereum, Solana, and Tron have shed over 8% in this period.
Decentralied Exchange protocols within the BSC ecosystem have processed more than $9.75 billion worth of tokens in the last seven days.
BNB price chart point

TTechnical indicators suggest that BNB has further upside potential in the long term. The token remains above both its short-term and long-term moving averages. Additionally, the Relative Strength Index and the MACD — two popular momentum oscillators — have continued to rise, signaling bullish momentum.
Binance coin has also formed a cup and handle chart pattern, a bullish continuation signal commonly seen in technical analysis. This pattern consists of two parts: the cup and the handle. In BNB’s case, the cup formed between May 2021 and July 2022, and the handle section is currently in progress.
If the pattern completes, BNB could see a price increase of more than 70%, potentially surging to over $1,180 in the long term.


