


Bitcoin price is holding above $114,000 as institutional demand strengthens, with spot exchange-traded funds registering their largest inflows in weeks.
Summary
- BTC trades is up 6.1% in 30 days and nearing $115K resistance.
- U.S. spot Bitcoin ETFs saw $429M inflows on Sept. 30, led by BlackRock.
- Technicals show neutral momentum but strong support, keeping the bullish case intact.
At press time, BTC traded at $114,400, up 0.5% in the past 24 hours and 1.5% over the week. Over the last 30 days, the asset has gained 6.1% and now sits just 7.9% below its record high of $124,128 reached on Aug. 14.
Daily trading volume came in at $56.3 billion, down 6.1% from the previous session, hinting at lighter activity in spot markets. In derivatives, Coinglass data shows mixed conditions.
Bitcoin (BTC) futures volume rose 2% to $80.95 billion, while open interest slipped slightly by 0.5% to $81.79 billion. This suggests traders are active but keeping leverage in check.
BTC spot ETF inflows strengthen “Uptober” outlook
ETF flows continue to drive optimism as October begins. Data from SoSoValue shows U.S. spot Bitcoin ETFs brought in $429.9 million in net inflows on Sept. 30, marking a second straight day of gains.
BlackRock’s IBIT led the way with $199.4 million, followed by Ark Invest’s ARKB at $105.7 million and Fidelity’s FBTC with $54.7 million. No ETF reported outflows, pushing total monthly inflows to $3.53 billion. Analysts suggest this trend could extend into Q4.
Over the past year, Bitcoin’s market capitalization has increased from $870 billion to $1.07 trillion, with average daily inflows of $385 million, according to Carmelo Alemán, a contributor to CryptoQuant. Large wallet accumulation and cautious miner selling indicate a structurally bullish market, and record-high global liquidity may help BTC’s rise even more.
Alemán argued that these factors set the stage for a new all-time high, with an ambitious projection of $180,000 within Q4.
Bitcoin price technical analysis
Bitcoin is consolidating just below the $115,000 resistance level. Bollinger Bands indicate that volatility is likely to increase as the price leans toward the upper band. While the stochastic reading of 61 suggests the market is not yet overheated, the relative strength index is at 54, indicating neutral momentum.
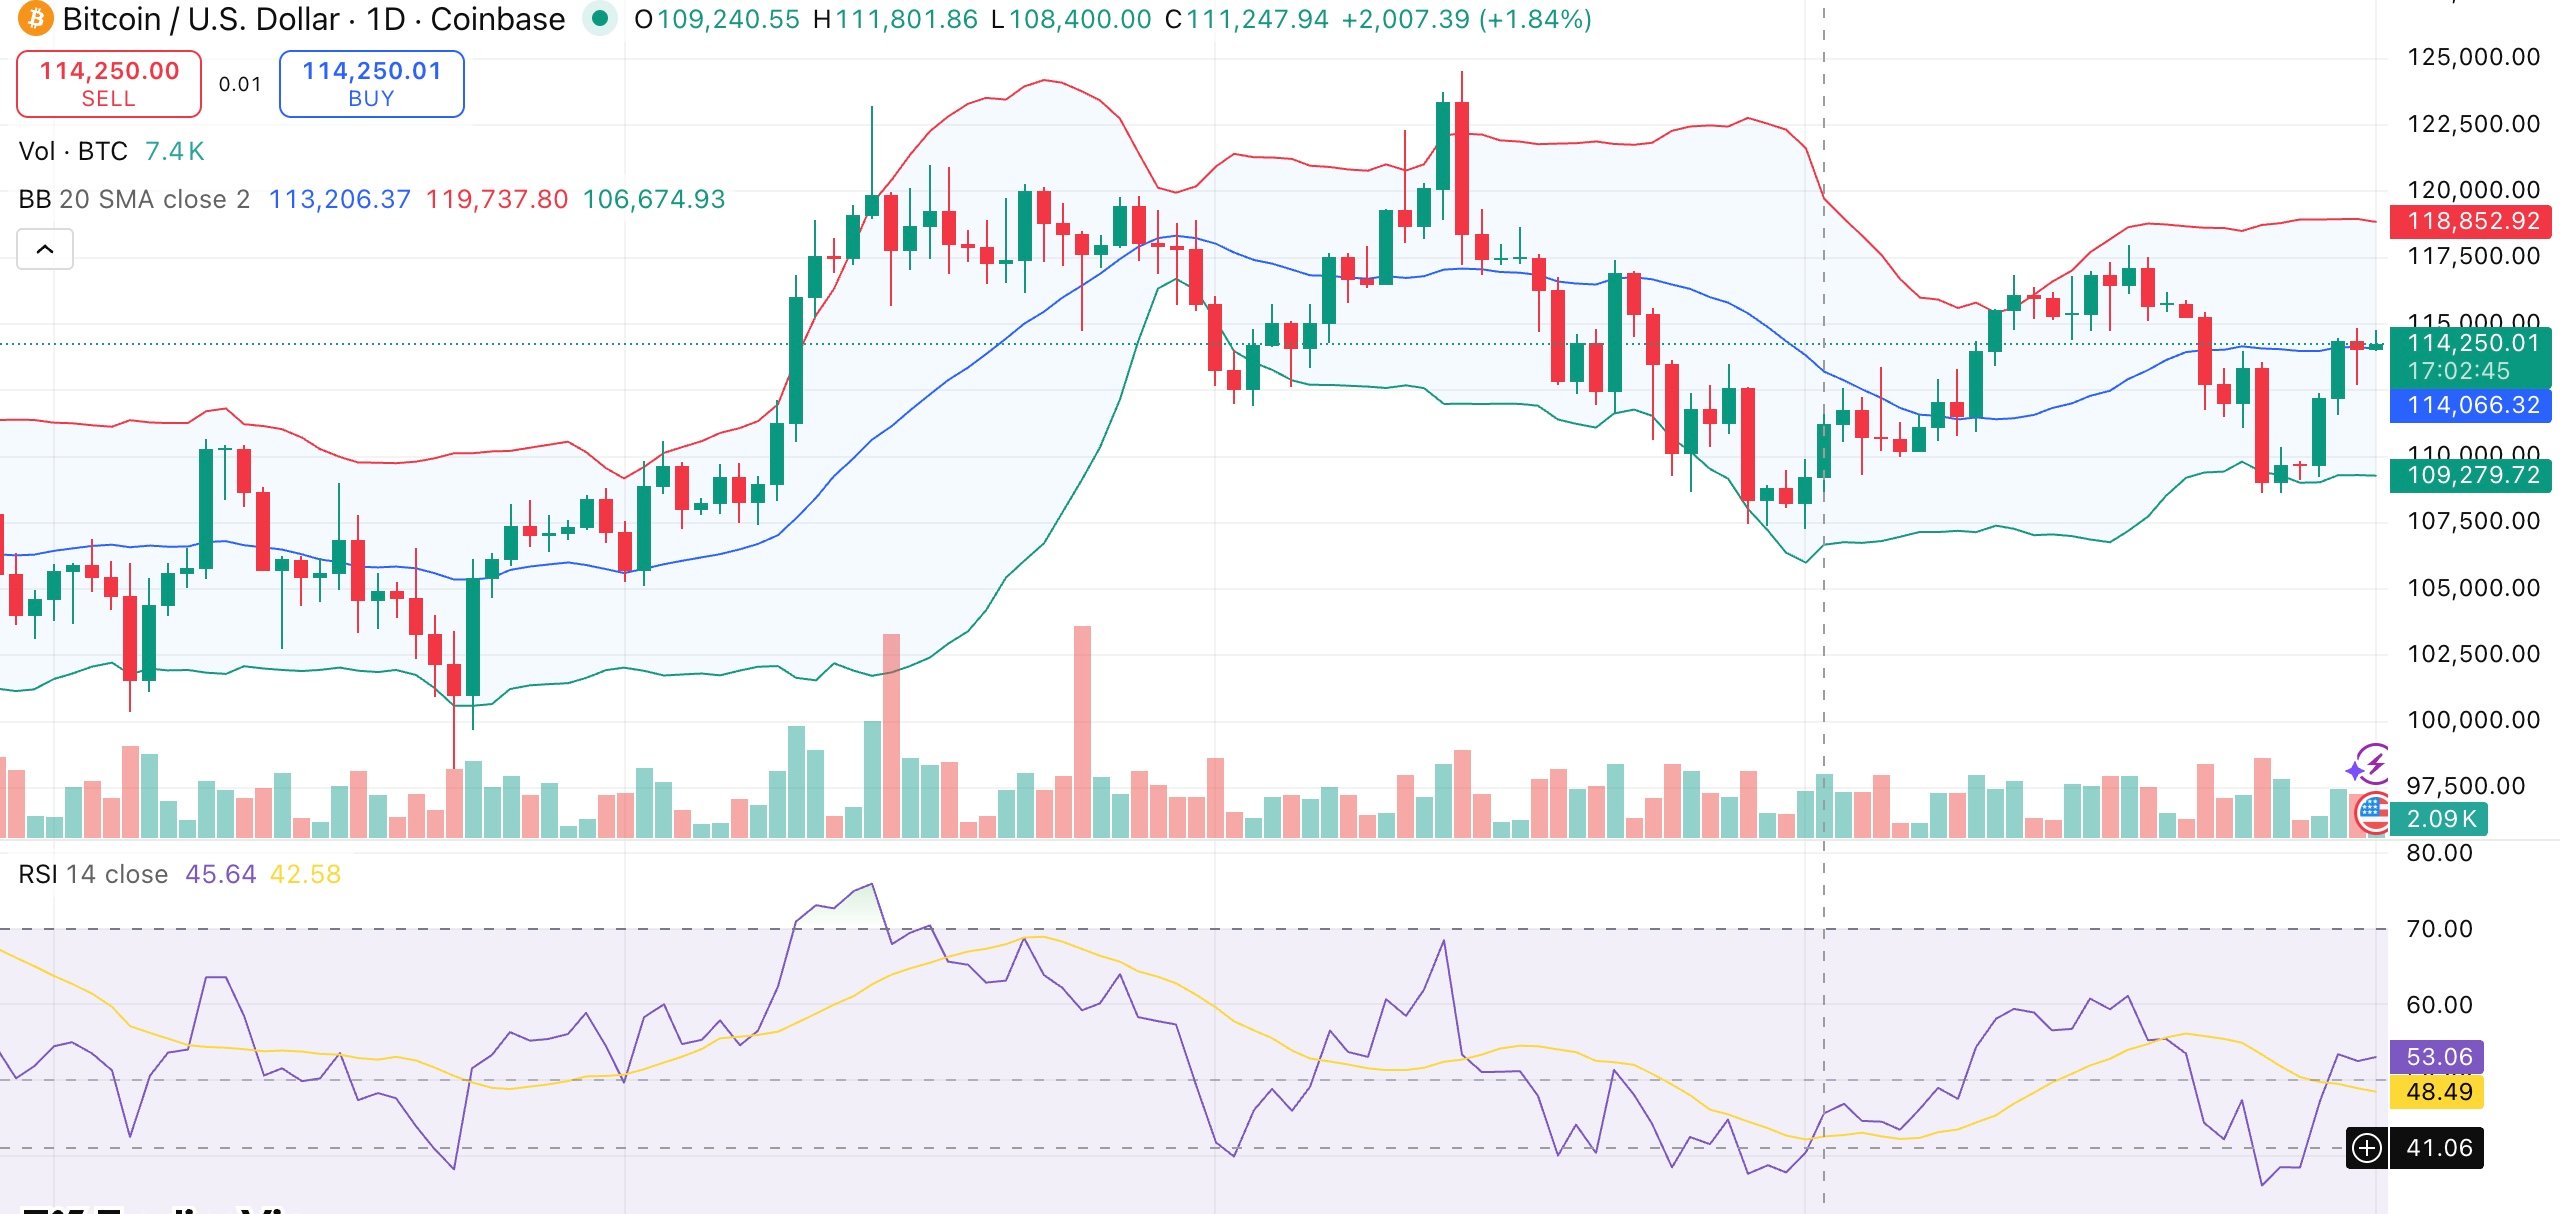
The bullish case is supported majority of moving averages. The 200-day simple moving average at $104,920 offers a solid floor, and both the short- and long-term averages are still in buy territory. A strong breakout above $115,000 could open the door to August’s high, which is close to $124,000. Immediate support lies around $113,000.
In a bullish scenario, if institutional accumulation and ETF demand persist, Bitcoin could rise to new highs. Although the overall structure is still supportive, a bearish turn would probably result in a retest of $110,000.