


Ethereum price rose nearly 7% on drawing closer to the $2,200 psychological resistance level after reports suggested that the U.S.-Iran war could end soon.
Summary
- Ethereum price rose nearly 7% to $2,153, rebounding from recent losses.
- Risk sentiment improved after signals of a possible ceasefire between Iran and the U.S.
- A cup and handle pattern has formed on the daily chart.
According to data from crypto.news, Ethereum (ETH) price rose to a six-day high of $2,153 on Wednesday, April 1.
The recovery followed after the leading altcoin fell nearly 16% from its monthly high of $2,360 to $1,972 earlier on Monday. The drop occurred amid growing uneasiness in the market due to the back-and-forth attacks between the U.S. and Iran. A ripple effect of it was the blockade at the Strait of Hormuz, a key maritime corridor that has pushed oil prices to record highs.
Ethereum price rebounded following reports that Iran’s president is willing to end the war with the U.S. and Israel if certain conditions are met.
While details of the demands are still not clear at the time of writing, they have previously called for more control in the Strait of Hormuz region, compensation for wartime damages on the nation, allowing it to continue its nuclear energy program, and a guarantee that the U.S. will not launch another attack on the country.
The U.S., for its part, has also signaled a potential ceasefire with Iran, even if the Strait of Hormuz remains closed, although Gulf countries like Saudi Arabia and the UAE have urged the U.S. to continue the war until the blockade is cleared.
Later today, U.S. President Donald Trump is set to give a speech where he will share major updates on Iran relations.
Notably, the impact of a potential resolution was already felt on energy markets as WTI oil prices dropped nearly 5% shortly following the report. Simultaneously, the crypto market surged along with U.S. equities such as the S&P 500.
Signs of de-escalation have offered Ethereum traders some short-term relief, easing the bearish pressure that emerged after Google’s quantum computing research raised concerns that Ethereum’s encryption could eventually be compromised.
On the daily chart, Ethereum price has formed a cup and handle pattern, a popular bullish continuation pattern in technical analysis. ETH price has recently broken out of the handle pattern, a sign that the upward trend is resuming.
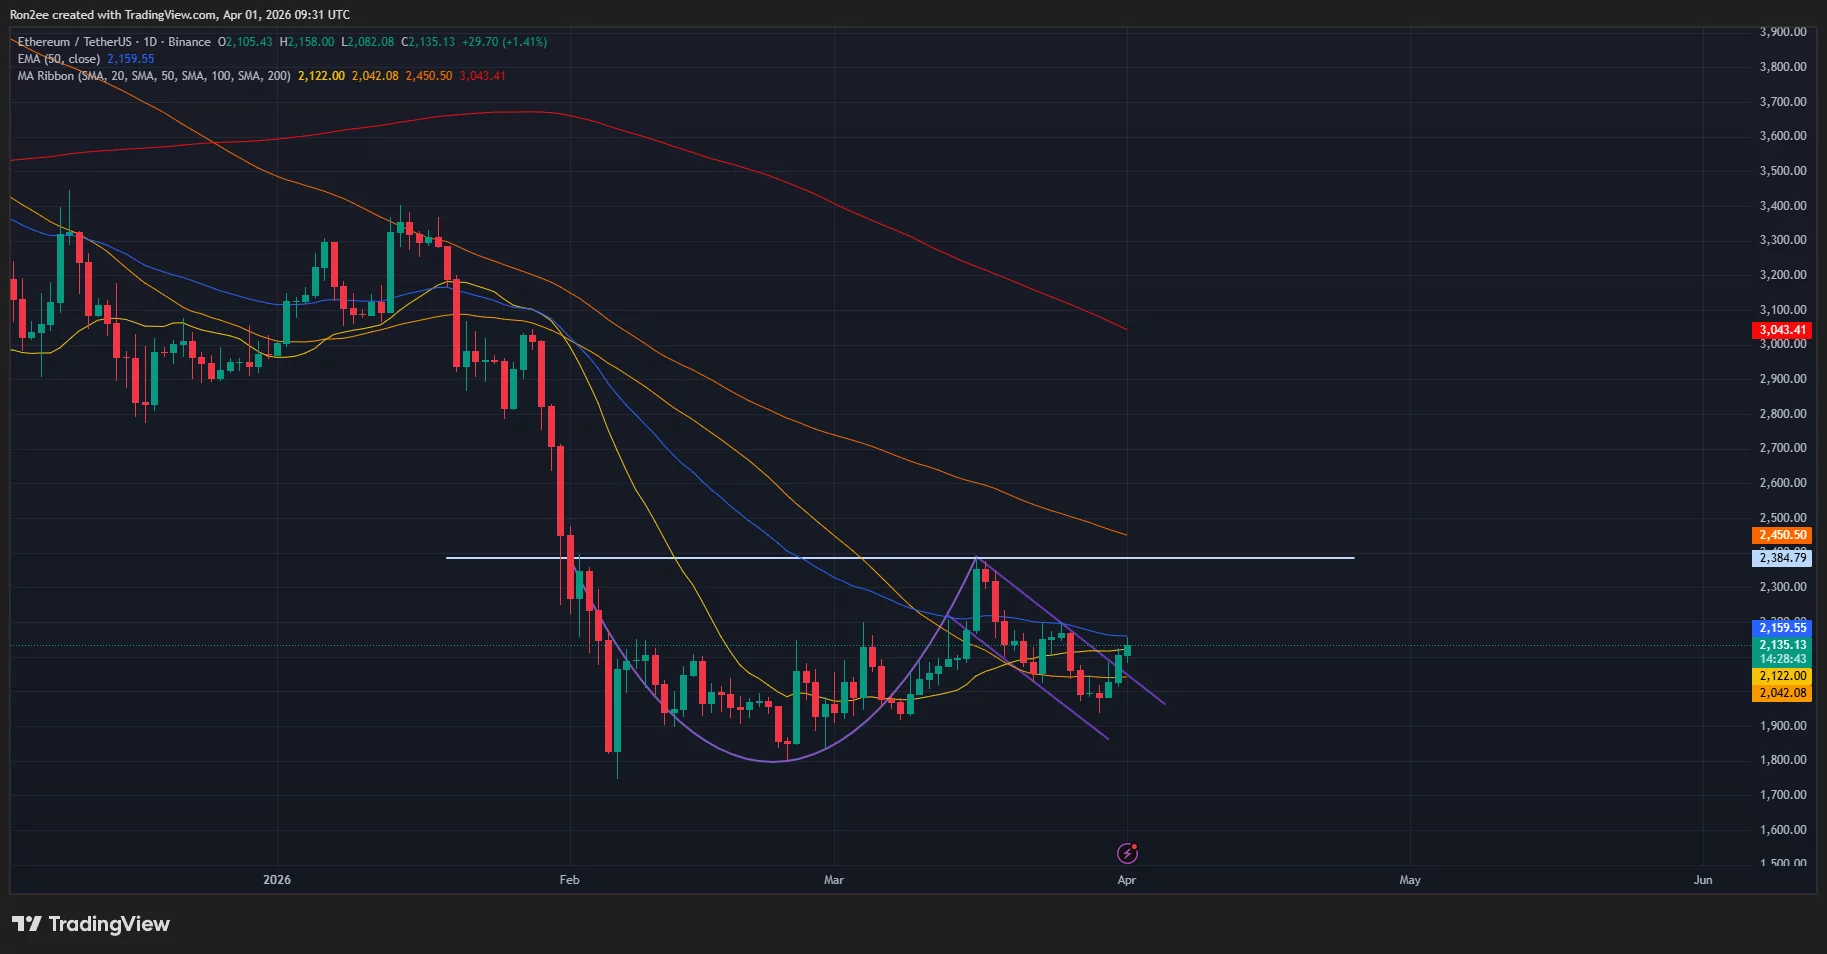
Technical indicators suggest bulls have the upper hand at the moment. Notably, the 20-day SMA has crossed above the 50-day SMA, with Ethereum price eyeing the 50-day EMA next at $2,160. Additionally, the supertrend has flashed green, indicating a buy signal.
Hence, the next immediate resistance level that traders would be keeping an eye on lies at $2,200, a level where previous selling pressure has historically intensified.
A break above this level could spur Ethereum towards the neckline of the cup and handle pattern at $2,384, with the next major target at $2,450, which coincides with the 100-day SMA.
Disclosure: This article does not represent investment advice. The content and materials featured on this page are for educational purposes only.


