


Hyperliquid price has climbed above $60 after futures open interest reached $2.56 billion, with growing SpaceX speculation supporting a falling wedge breakout toward the $75 region.
Summary
- HYPE open interest climbed to $2.56 billion, surpassing XRP as traders increased exposure ahead of SpaceX-related trading activity.
- Hyperliquid’s $10.4 billion daily perpetual volume, buyback model, and USDC integration continue supporting demand for HYPE.
- A falling wedge breakout and bullish momentum indicators point to a potential retest of the $75-$78 resistance zone.
According to data from CoinGlass, Hyperliquid (HYPE) price was trading near $60 on June 12 after gaining more than 7% over the past 24 hours, while futures open interest rose 6.3% over the previous 24 hours to $2.56 billion. The increase pushed HYPE ahead of XRP, whose open interest stood at $2.48 billion after a smaller 2% daily increase.
The move comes as Hyperliquid captures a growing share of trading activity tied to SpaceX’s public market debut. Through its synthetic SPCX perpetual market, traders have been using the platform to gain exposure to SpaceX before trading begins on traditional exchanges.
Data from Hyperliquid markets showed implied valuations rising well above the company’s IPO pricing, drawing substantial speculative interest and helping drive trading volumes higher.
Earlier this week, crypto.news reported that Hyperliquid overtook XRP in futures open interest after Kalshi launched CFTC-regulated HYPE perpetual contracts. The development added another avenue for traders seeking exposure to the token and coincided with a double-digit gain in HYPE price.
Market participants have also positioned for increased activity surrounding the IPO. Commenting on the setup, analyst Altcoin Sherpa said he was long HYPE ahead of SpaceX’s public debut, noting that the event could bring “a ton of volume” and attract more attention to Hyperliquid’s markets.
Fee-driven buybacks continue supporting demand
Beyond speculation surrounding SpaceX, Hyperliquid’s tokenomics have continued to attract investor attention. Trading activity across perpetual futures, spot markets, HIP-3 builder markets, and HLP vault operations generates protocol revenue that supports demand for HYPE.
Through the protocol’s Assistance Fund, a portion of that revenue is used to purchase HYPE on the open market, while staking the token unlocks trading fee discounts that increase with stake size, giving traders another incentive to hold the asset.
Recent developments involving Circle’s USDC have added to that narrative. Following an integration between Hyperliquid, Coinbase, and Circle, USDC became the primary aligned quote asset across the network’s markets. The arrangement routes at least 90% of the yield generated from USDC deployed on Hyperliquid toward HYPE buybacks, creating an additional source of demand as activity on the platform expands.
These dynamics have become more visible as trading volumes continue to climb. Hyperliquid processed roughly $10.4 billion in 24-hour perpetual futures volume, while increased activity across the platform strengthened the revenue streams that support HYPE buybacks.
Falling wedge breakout point toward a retest of ATH
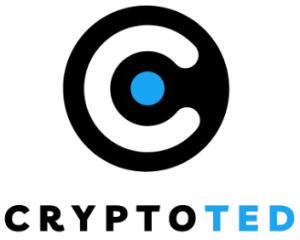
Chart data shows HYPE attempting to break out from a multi-week falling wedge that formed after the token reached its all-time high near $75.5 in early June.
On the four-hour chart, the breakout occurred near the upper boundary of the wedge after price established support around the $54-$55 region. The pattern’s measured move projects roughly 20% upside from the breakout zone, placing a potential target near $77.8, slightly above the previous record high.
Momentum indicators have also improved. The four-hour MACD has produced a bullish crossover while the RSI has recovered above the neutral 50 level, suggesting buying pressure has strengthened following the recent correction.
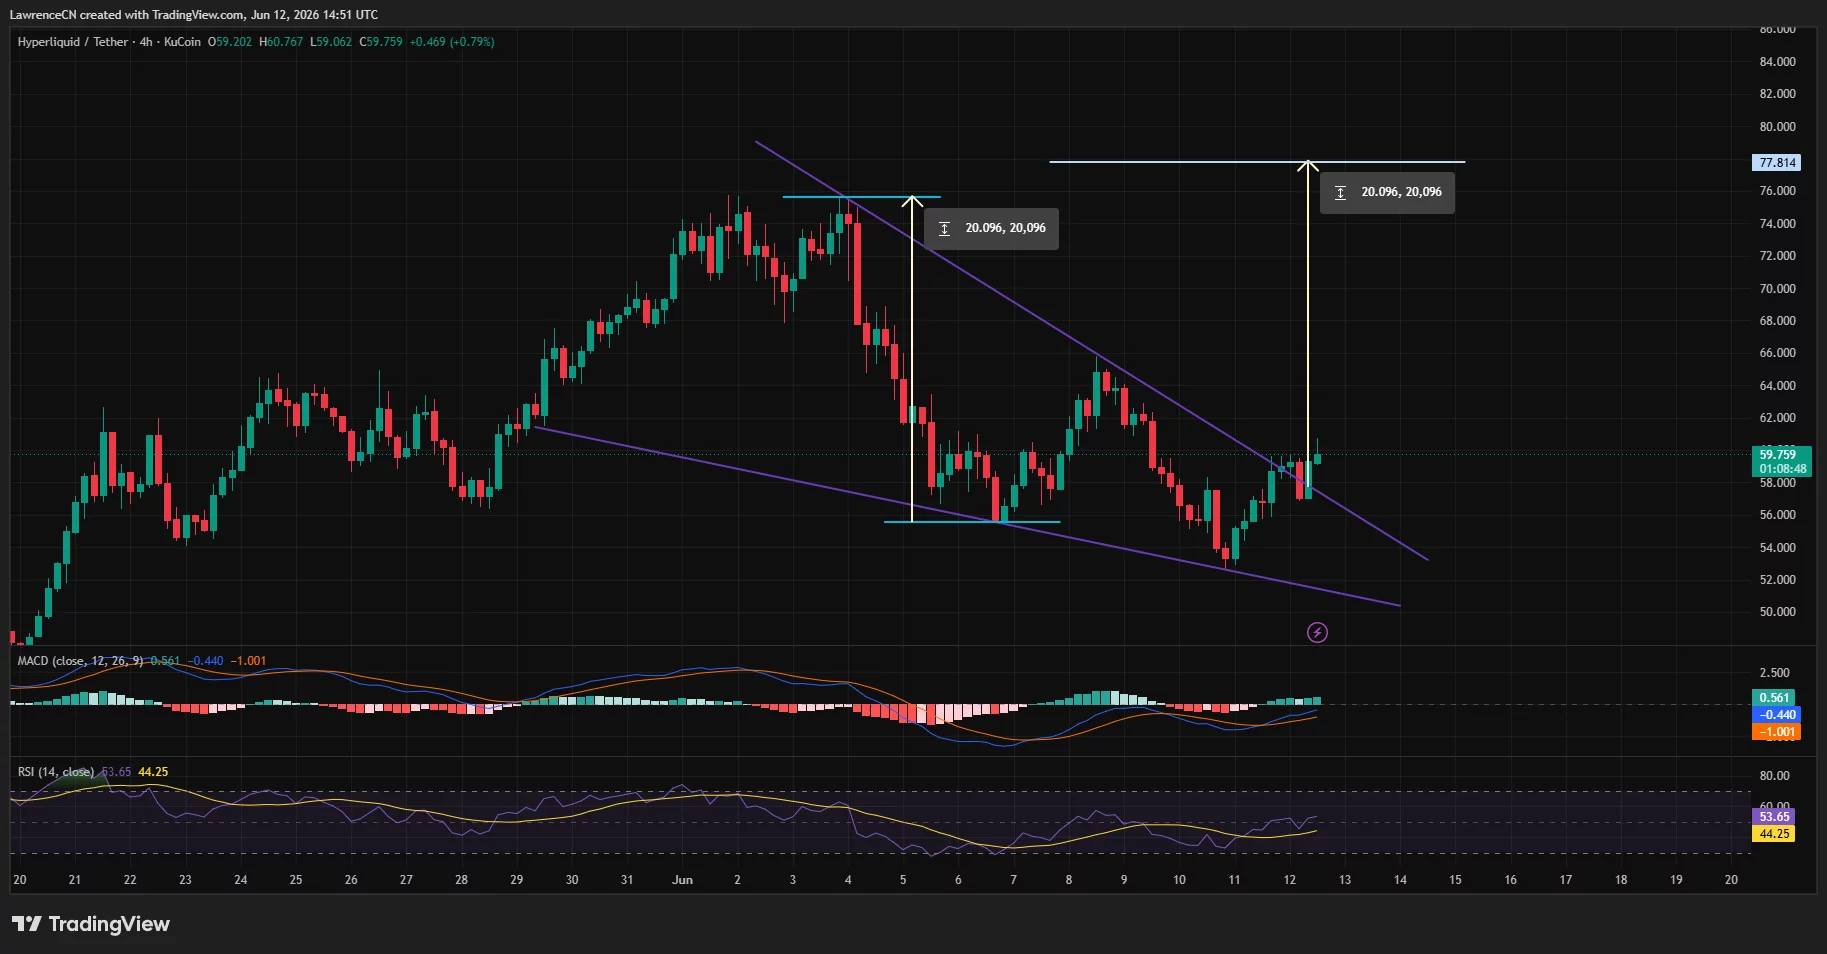
The daily chart shows another key battle unfolding near the 0.618 Fibonacci retracement level at $61.39. A successful move above that area could expose the next resistance at $67.69, while the all-time high near $75.7 remains the primary bullish target.
The Supertrend indicator, however, continues to sit higher near $74.3, indicating that the longer-term trend has not yet fully turned bullish.
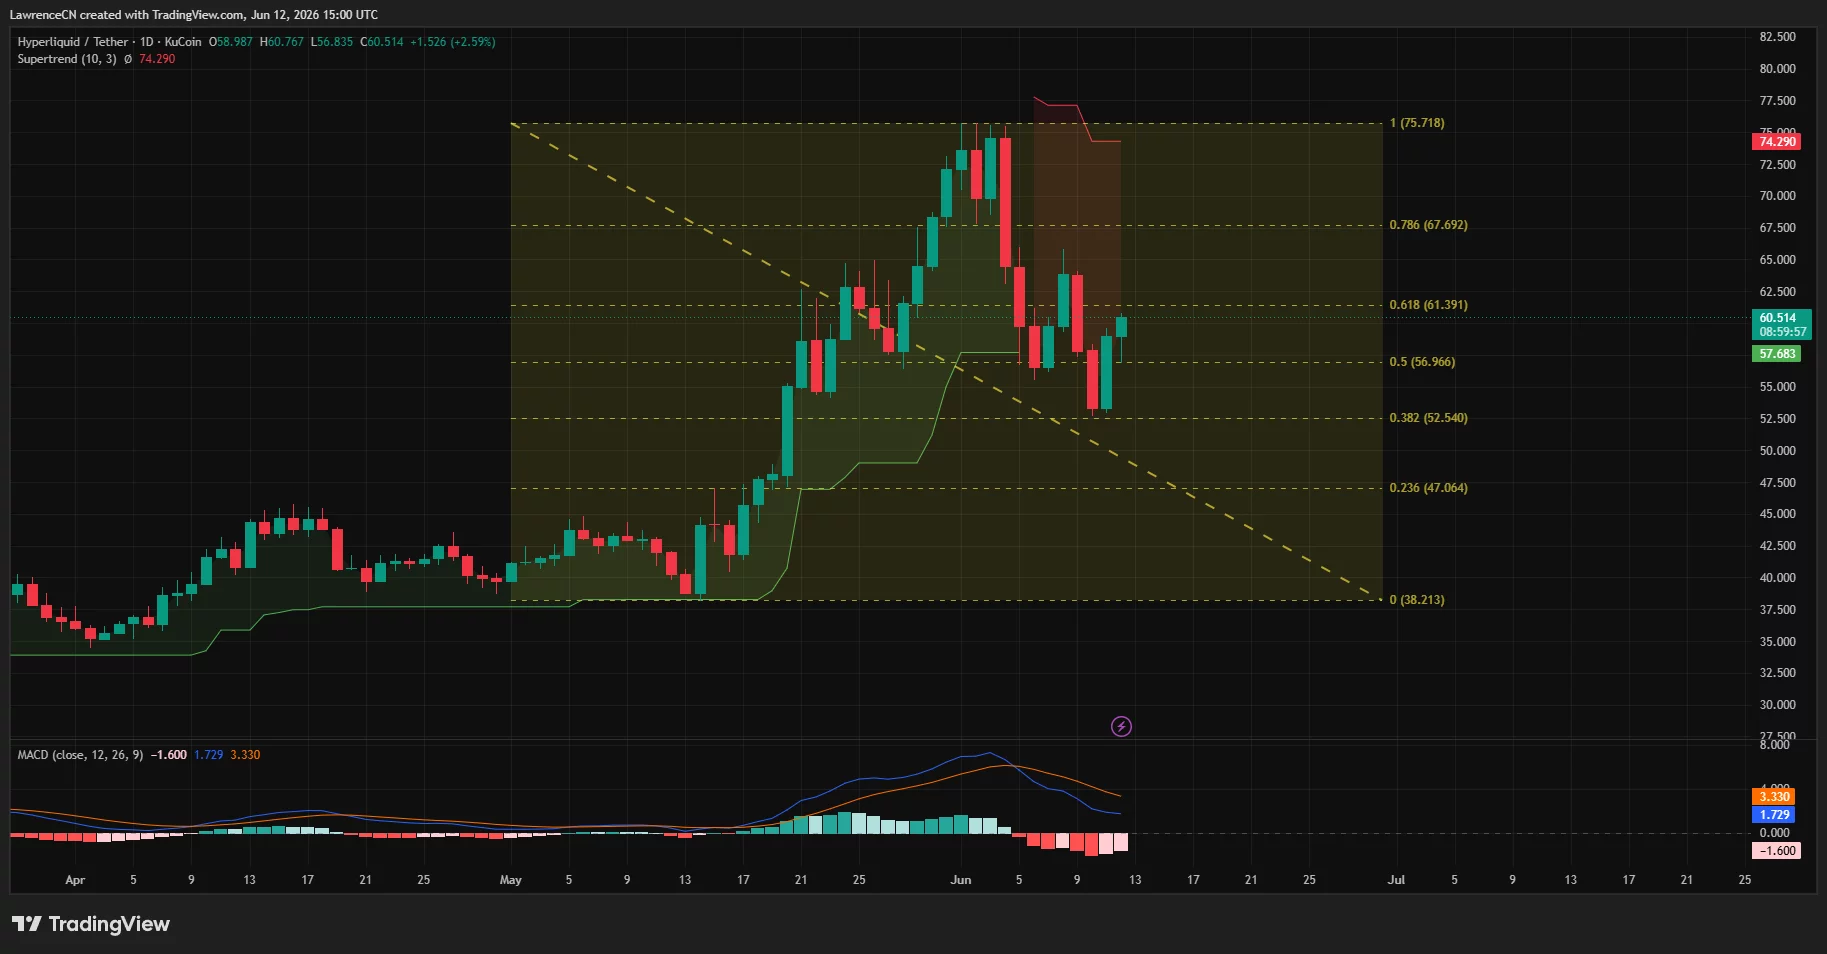
Liquidation data from CoinGlass adds support to the recovery case. The latest three-day HYPE liquidation heatmap shows a concentration of short liquidations clustered between $61.5 and $63, with another notable liquidity pocket near $63.
Analysts often view such zones as potential magnets for price action, particularly when momentum and open interest are rising simultaneously.
A move through those levels could strengthen the case for a retest of the $75 region, while a failure to hold above $57-$58 may shift attention back toward support around $54-$55.
Disclosure: This article does not represent investment advice. The content and materials featured on this page are for educational purposes only.


