


Bitcoin price has confirmed a bearish head-and-shoulders breakdown, putting the $60,000 support zone under pressure as traders react to easing Middle East tensions and persistent institutional selling.
Summary
- Bitcoin price has confirmed a bearish head-and-shoulders breakdown, exposing a potential decline toward the $57,500 support zone.
- More than $600 million in crypto liquidations, persistent ETF outflows, and weak Coinbase premium data have added to selling pressure.
- Traders are closely watching the $60,000-$60,600 support area, with a break below it risking a deeper correction.
According to data from crypto.news, Bitcoin (BTC) price dropped from an intraday high near $64,500 to a low of $61,990 on June 23 before stabilizing around the $62,000 area.
Bitcoin’s decline coincided with a sharp drop in oil prices after reports of progress in U.S.-Iran negotiations and a 60-day waiver allowing purchases of Iranian crude pushed Brent crude to its lowest level in nearly three months.
At the same time, a selloff in artificial intelligence and semiconductor stocks weighed on risk sentiment across global markets, while gold fell roughly 1.5% and silver slid more than 5% as traders unwound defensive positions.
Crypto derivatives markets amplified the selloff, with over $600 million in liquidations recorded in 24 hours, the bulk of which came from long positions.
Meanwhile, institutional demand remains weak after U.S. spot Bitcoin ETFs entered one of their longest outflow streaks this year, removing a key source of demand that had previously helped cushion selling pressure in the spot market. Coinbase’s premium has also remained negative, suggesting U.S. investors have been selling rather than accumulating during recent sessions.
Although diplomatic developments have eased fears of an immediate Middle East supply shock, uncertainty continues to linger over the durability of the emerging agreement. As recent reports revealed, Iran’s President has rejected negotiations over the country’s ballistic missile program, while Tehran and Washington continue to dispute claims regarding nuclear inspections.
Iran’s chief negotiator also warned that the Strait of Hormuz would never return to its pre-war conditions despite commercial traffic gradually recovering.
All these factors, combined with growing expectations that the Federal Reserve could keep interest rates elevated or even consider another hike later this year, have left retail investors on the sidelines, with many waiting for clearer market direction before re-entering positions.
Bitcoin price breakdown targets $57K support zone
The technical picture deteriorated after Bitcoin confirmed a head-and-shoulders pattern on the 4-hour chart. The breakdown occurred when BTC price fell below the neckline near $63,000, completing a structure that began forming earlier this month.
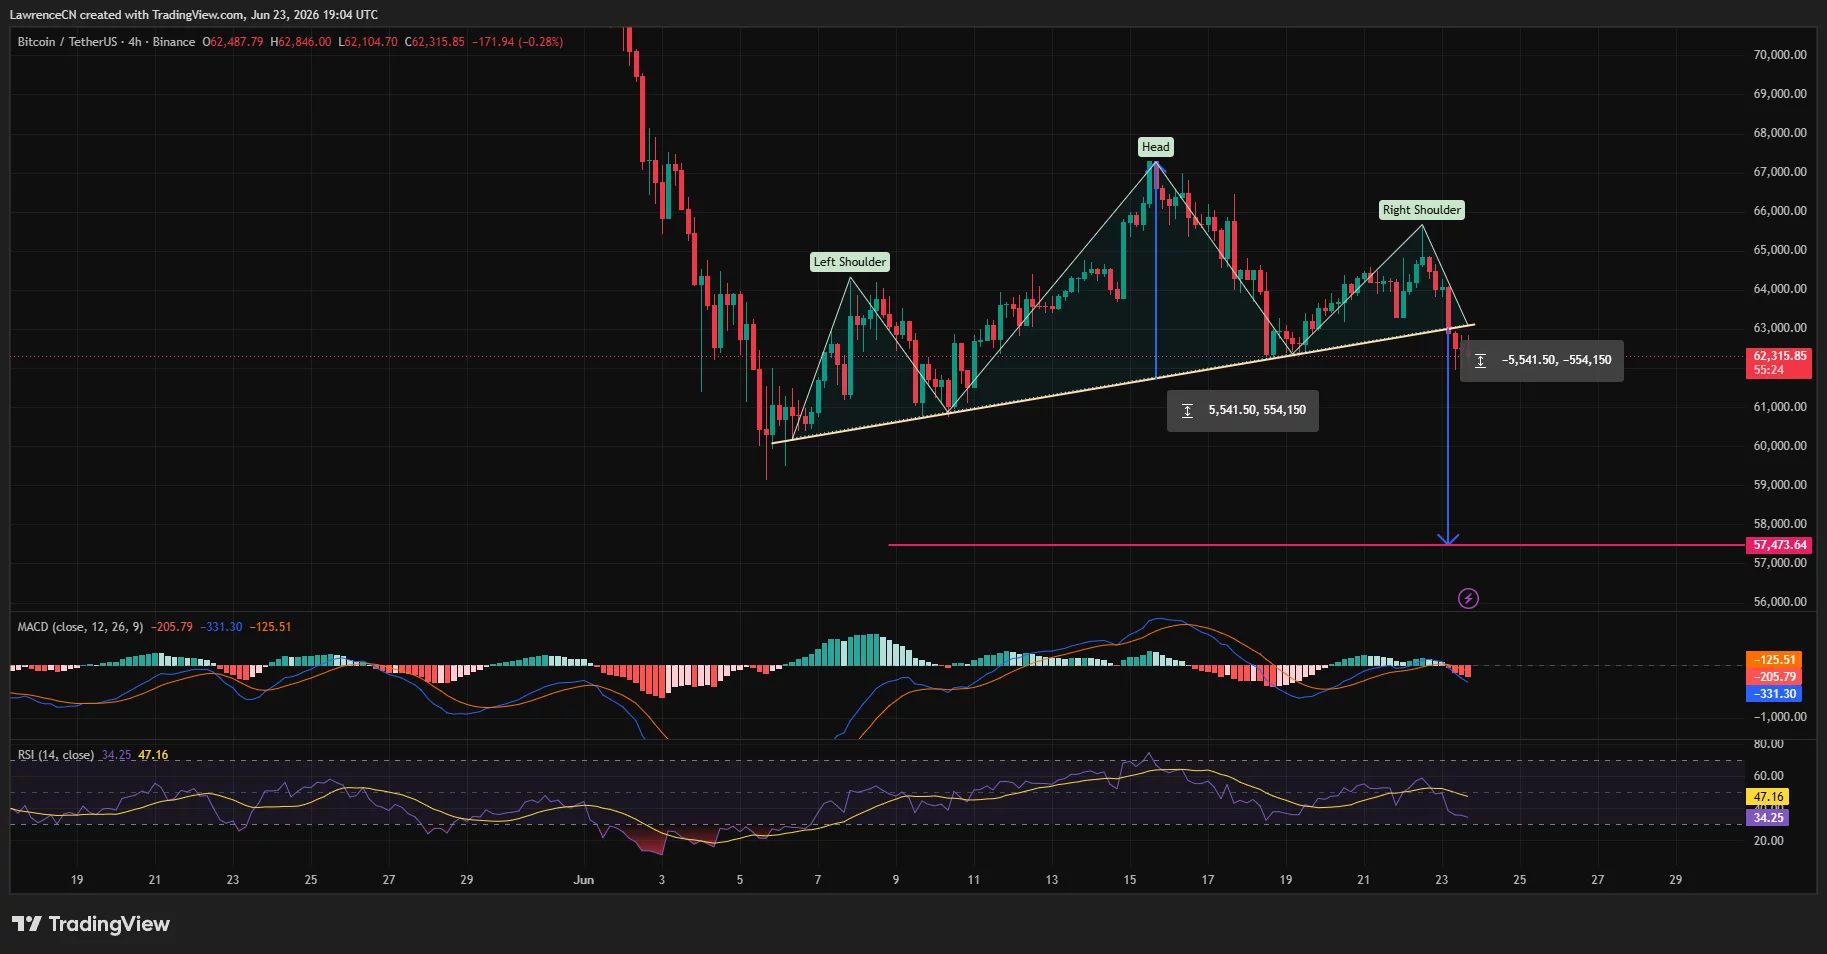
Using the measured-move projection from the pattern, the downside target sits near $57,500, implying another decline of roughly 8% from current levels. The move also pushed BTC below a key ascending trendline that had supported price action since the June 5 rebound from below $60,000.
Momentum indicators seemed to favour the sellers when writing. The MACD remains below its signal line with expanding negative momentum, while the Relative Strength Index has dropped toward oversold territory without yet showing a clear bullish divergence.
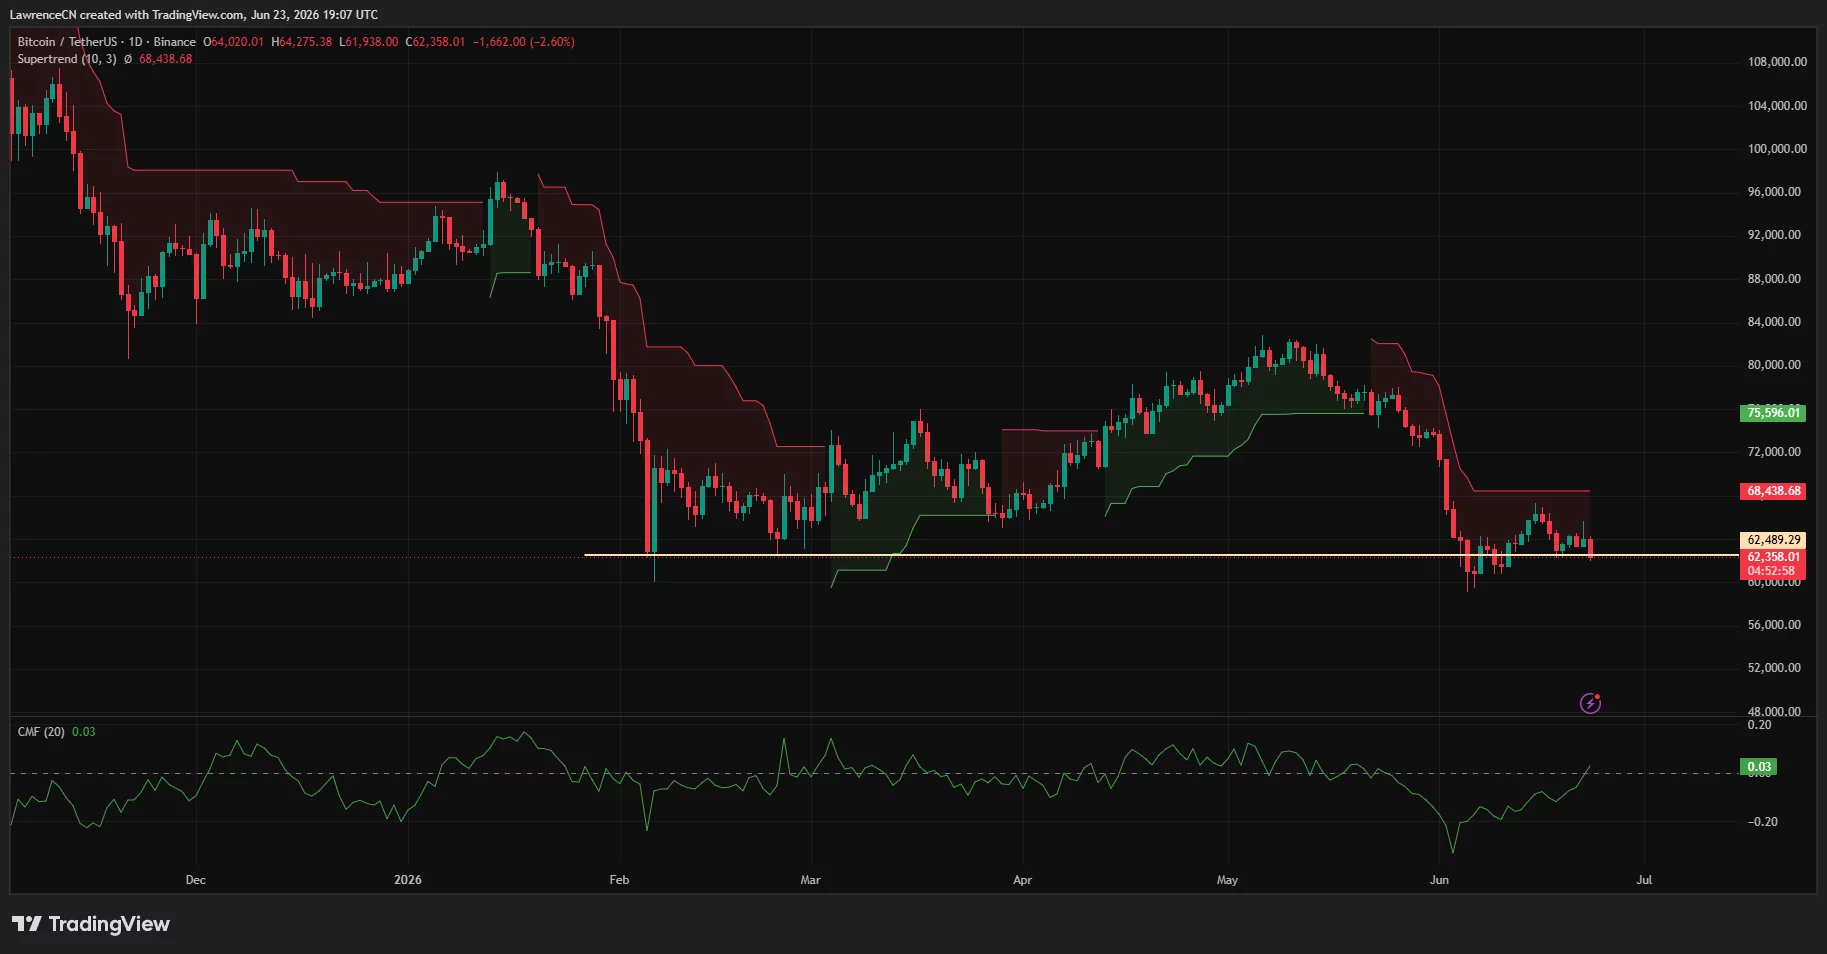
The daily chart presents a similar bearish picture. Bitcoin price remains below its Supertrend resistance at roughly $68,400 and continues trading beneath a major resistance zone that rejected buyers throughout June. Although Chaikin Money Flow has turned slightly positive, suggesting some capital is still entering the market, bulls have so far failed to reclaim lost technical levels.
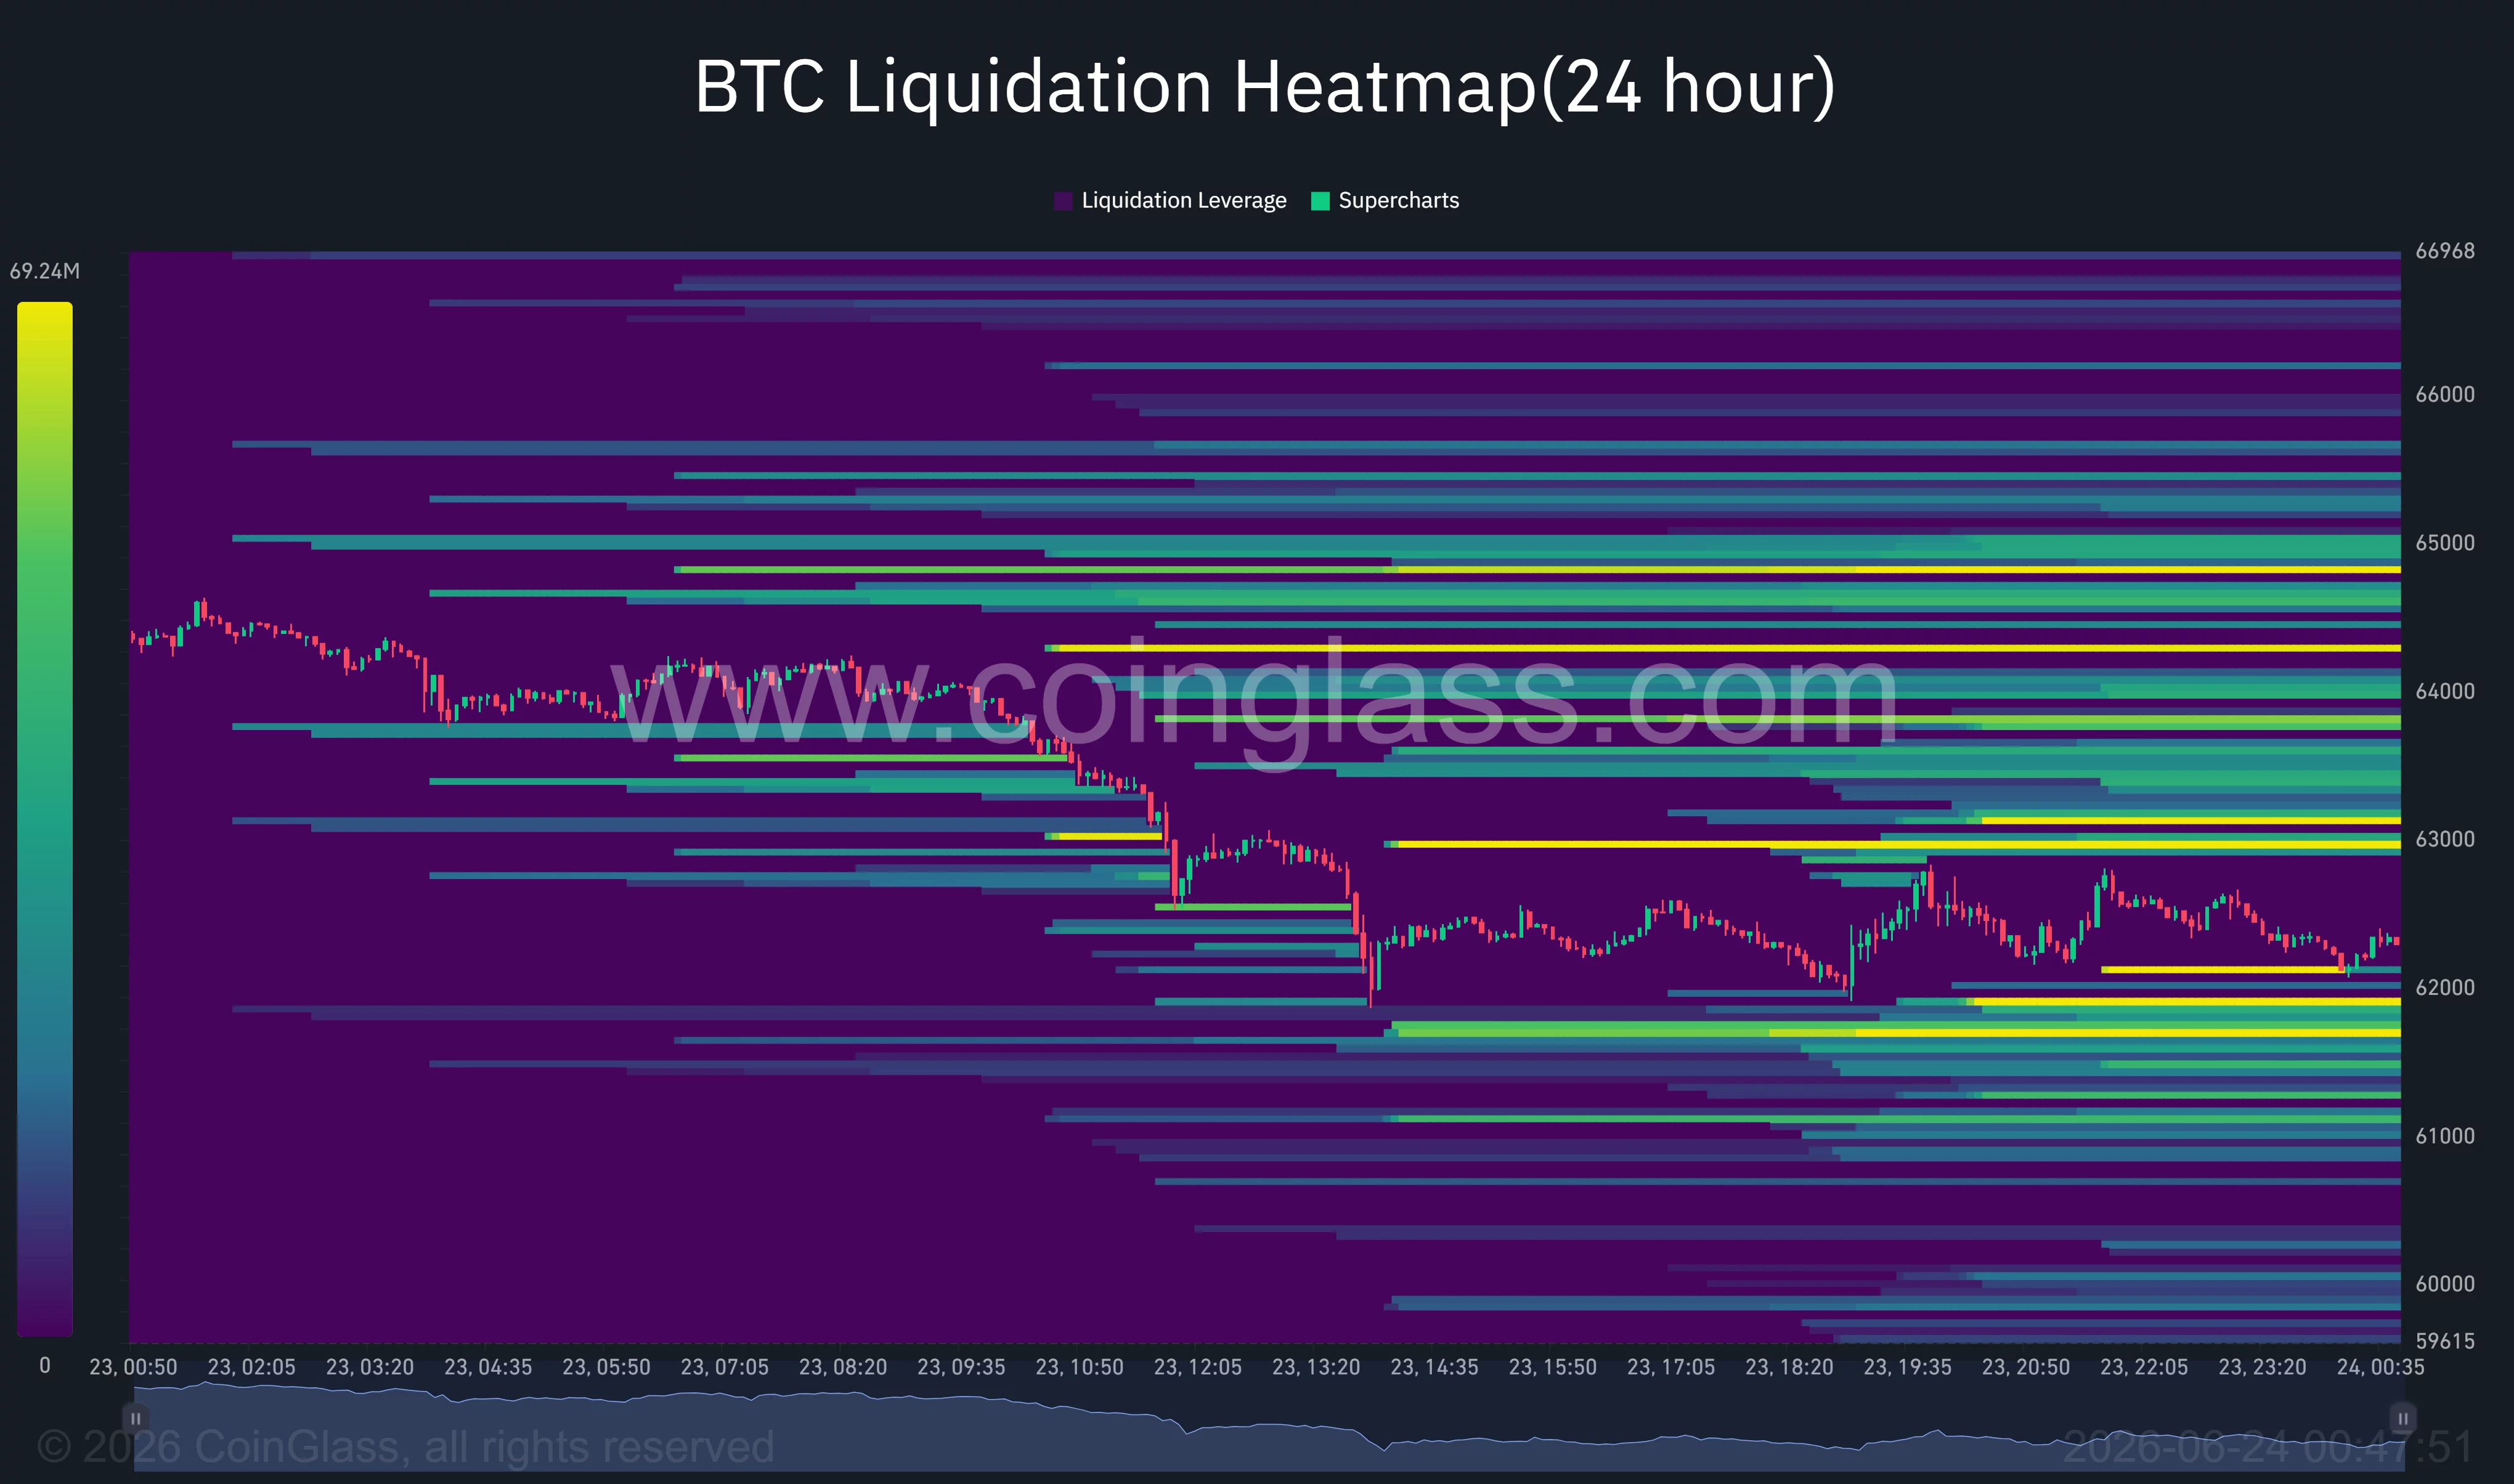
The daily CoinGlass liquidation heatmap shows a dense concentration of leveraged positions between $63,000 and $65,000, creating a major liquidity zone above the current price. Additional liquidation clusters are visible around $61,500 and $60,000, suggesting volatility could increase if Bitcoin moves into either area.
Commenting on the matter, analyst Ali Martinez noted that more than 1.3 million BTC changed hands between $60,000 and $63,000, making it Bitcoin’s largest volume cluster.
“Immediate support at $60,587 must hold to maintain the current trend. A break below it opens a path to $46,702.”
June support zone remains key for invalidating the bearish setup
Several analysts continue to view June as a decisive month for Bitcoin’s medium-term trend despite the recent breakdown.
According to analyst Ardi, previous bear markets in 2018 and 2022 produced major June flushes before extended consolidation phases emerged later in the year. He argued that Bitcoin’s decline to roughly $59,000 earlier this month may have already fulfilled that historical pattern.
A recovery above the broken neckline near $63,000 would weaken the immediate bearish thesis and expose liquidation clusters around $65,000. Reclaiming that area could force short sellers to cover positions and potentially trigger a squeeze toward the $66,900-$68,400 resistance zone.
However, failure to defend the $60,000-$60,600 support region would place the June low near $59,000 at risk. Below that, technical support becomes increasingly limited until the head-and-shoulders target near $57,500, while deteriorating ETF flows, elevated Treasury yields, and continued weakness in global risk assets could accelerate downside pressure.
Disclosure: This article does not represent investment advice. The content and materials featured on this page are for educational purposes only.


