



Bitcoin price traded near $84,000 on Sep. 28 after retreating from a recent high above $87,000, leaving traders focused on whether U.S. spot ETF demand can help the price hold its September breakout.
Summary
- Bitcoin price traded near $83,960 on the daily chart, above its 20-day moving average of $80,730.
- U.S. spot Bitcoin ETFs drew about $2.39 billion in net inflows during the week ended Sep. 25.
- The 4-hour Supertrend remained bearish near $85,087, while ADX stood at 14.74.
- Bitget Wallet’s Lacie Zhang identified $81,500–$83,000 as the key area for the pullback.
Lacie Zhang, research lead at Bitget Wallet, told crypto.news that the retreat reflected profit-taking after Bitcoin’s rally, a reduction in leveraged long positions, firmer U.S. Treasury yields and a stronger dollar. She said rates, energy prices and geopolitical risks appeared to be the main sources of pressure, while changes in derivatives positioning made the decline faster.
Bitcoin’s Binance daily chart showed the price near $83,960, down 0.61% for the session at the time of the reading. It had moved away from the $87,000 area reached during last week’s advance but remained above its 20-day, 50-day, 100-day and 200-day simple moving averages.
Bitcoin ETF inflows slow after a strong week
U.S. spot Bitcoin ETFs recorded roughly $2.39 billion in net inflows from Sep. 21 through Sep. 25, according to Farside Investors. Daily inflows fell from $999 million on Monday to $134.5 million on Friday, with each of the five sessions still finishing positive.
Zhang said the continued purchases could support Bitcoin during the pullback, though the slower pace suggested investors were becoming more selective as yields rose. The distinction matters for U.S. investors because the ETF figures show fund demand remained positive through Friday even as Bitcoin gave back part of its rally.
“U.S. spot Bitcoin ETFs also remain net buyers,” Zhang said.
She described the $81,500–$83,000 range as the prior breakout area. In her view, holding that zone alongside continued net ETF inflows and contained liquidations would support a period of consolidation. Several sessions of ETF outflows, a further rise in the 10-year Treasury yield and a break below $82,000 would raise the risk of a deeper decline, she said.
Bitcoin’s daily trend holds while the 4-hour signal weakens
On the daily chart, Bitcoin remained above its 20-day simple moving average at $80,729.58 and its 50-day average at $76,510.45. The 100-day and 200-day averages stood at $69,942.10 and $71,176.27, respectively, placing all four below the price shown in the chart.
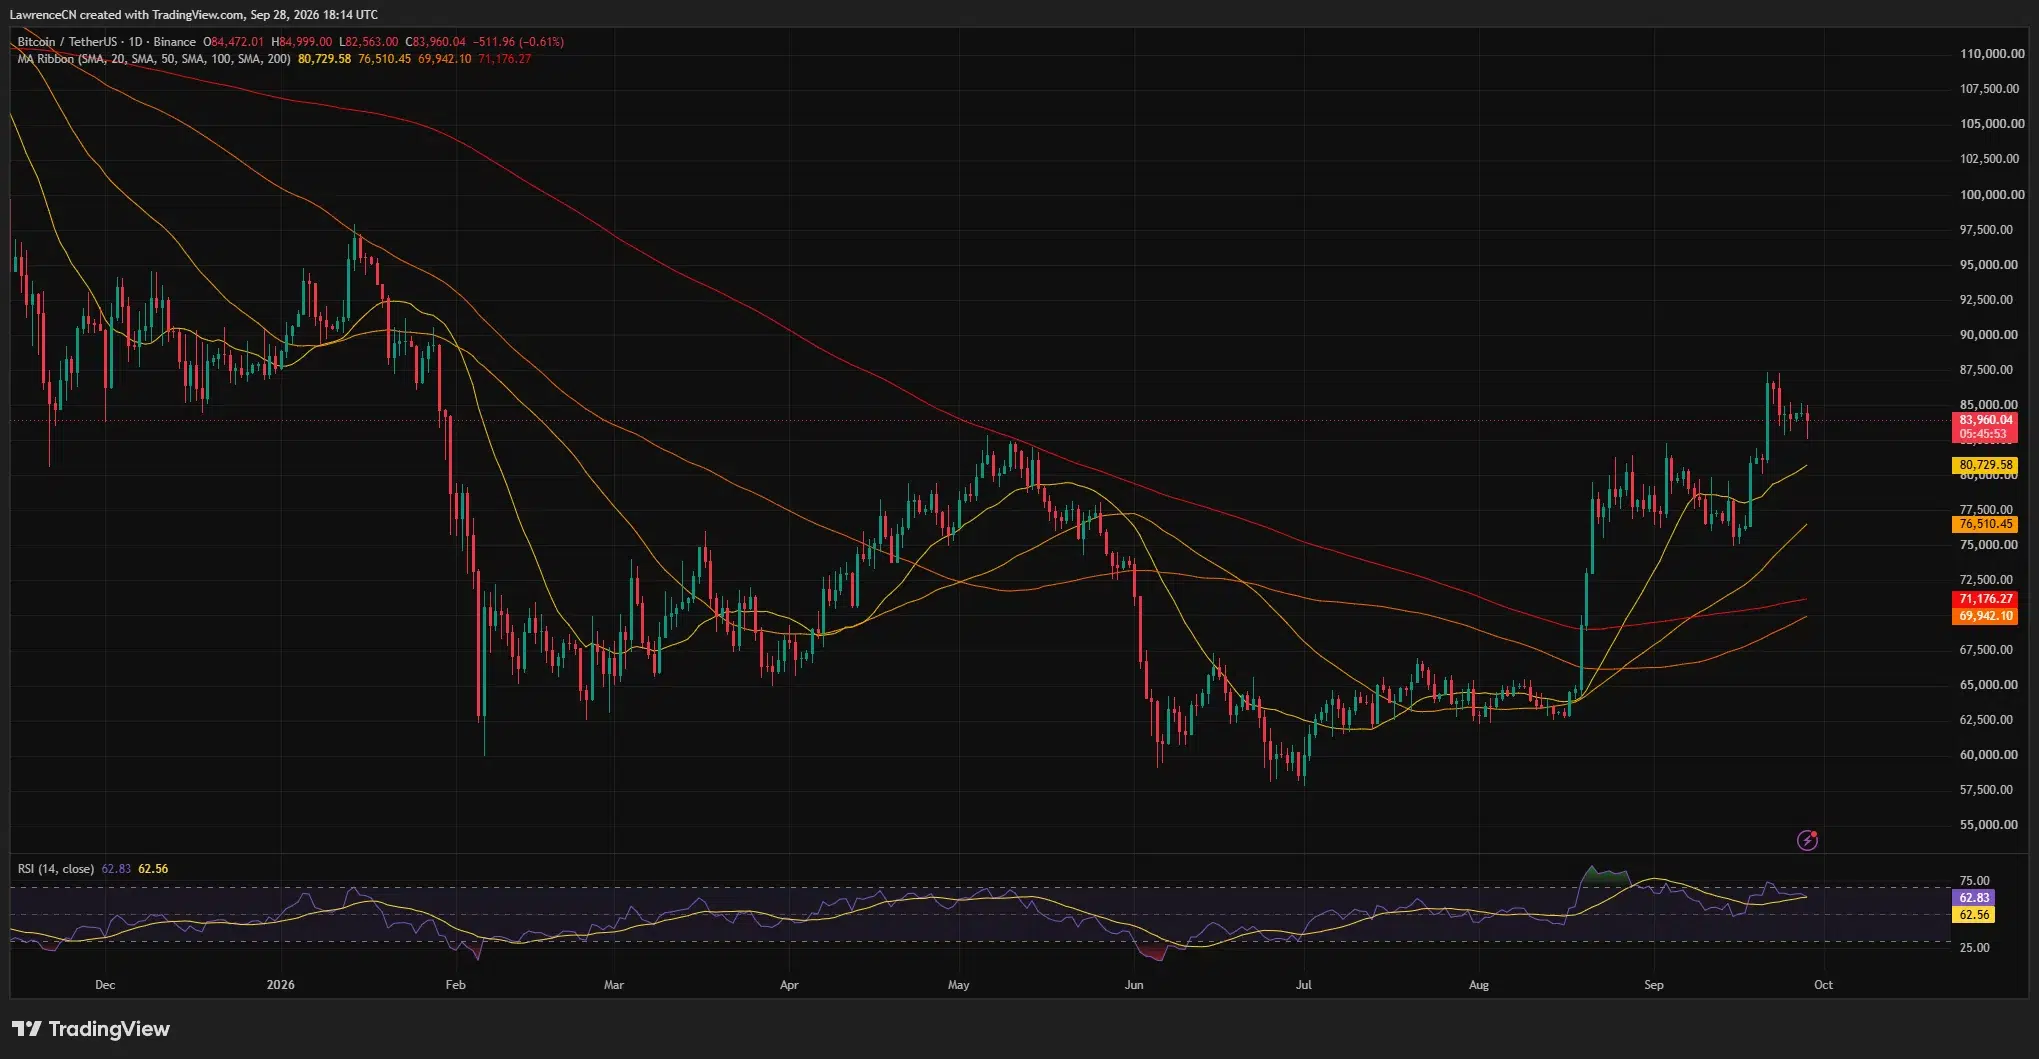
The daily relative strength index read 62.83. It had eased from the higher readings seen during the move toward $87,000 but remained above 50, while Bitcoin traded around $3,230 above its 20-day average. The price gap gives traders a second level to watch if Zhang’s breakout zone fails to hold.
The 4-hour chart showed a weaker near-term setup. Bitcoin traded near $83,972, below a bearish Supertrend line at $85,086.94. That indicator followed the price lower after the retreat from $87,000, leaving the $85,000 area as an immediate hurdle for a rebound.
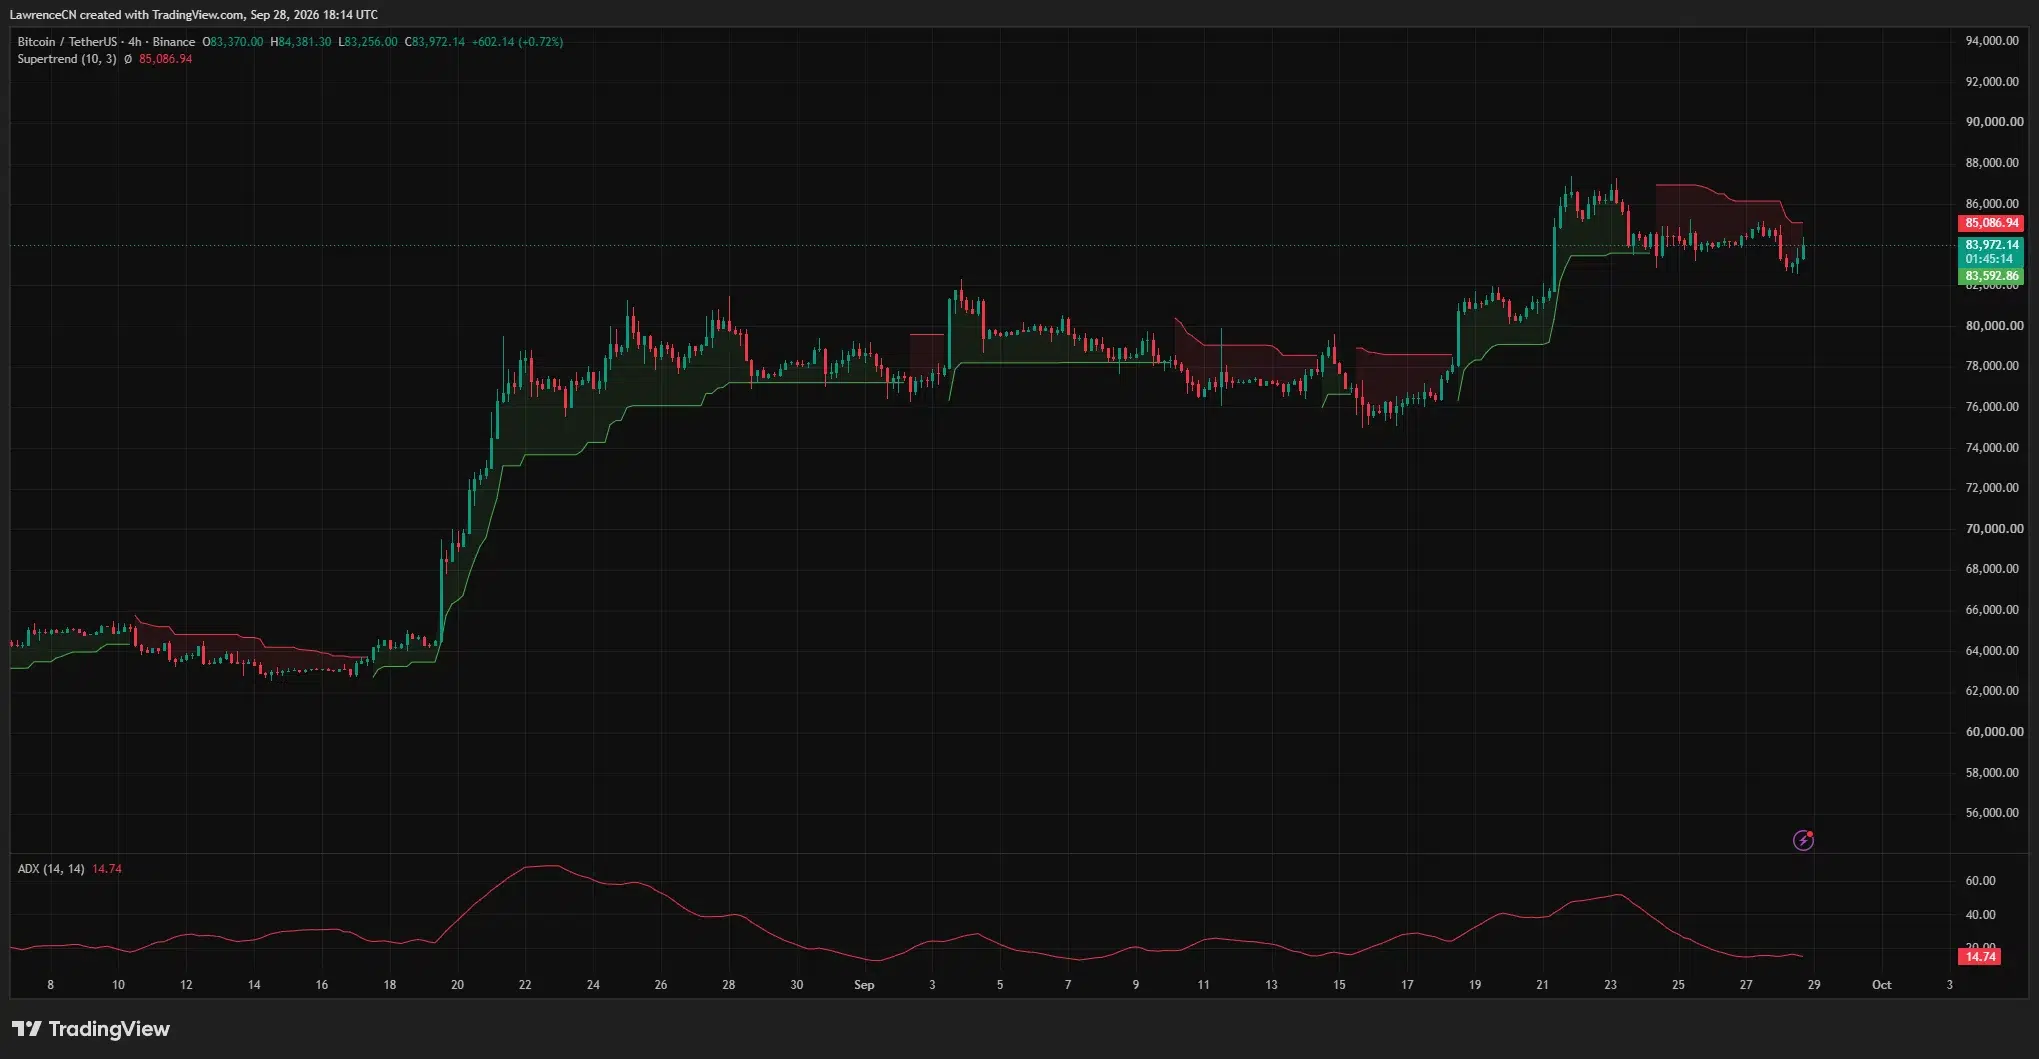
The 4-hour average directional index, or ADX, stood at 14.74. The low reading indicated that the recent sideways trading had little trend strength, even though the Supertrend signal remained bearish. Bitcoin had also rebounded from a nearby low around $83,256 on the 4-hour chart, putting that level close to the upper part of Zhang’s support range.
The $82K level could decide the next test
A move above the 4-hour Supertrend near $85,087 would put Bitcoin back toward its recent high around $87,000. The chart does not show a confirmed break of that high, and the lower ADX reading leaves room for further range-bound trading before a stronger move develops.
On the downside, the 4-hour low near $83,256 is the first nearby level. Zhang’s $81,500–$83,000 breakout range sits below it, followed by the daily 20-day moving average near $80,730. A decline through $82,000 would meet one of the conditions Zhang identified for a deeper correction, particularly if U.S. ETF flows turn negative for several sessions.
The next published ETF figures will help show whether Friday’s slower inflow was part of a continuing drop in purchases. For now, Farside’s five positive sessions and Bitcoin’s position above its daily moving averages sit alongside a bearish 4-hour Supertrend, leaving the $82,000–$85,000 area at the center of the near-term price test.
Disclosure: This article does not represent investment advice. The content and materials featured on this page are for educational purposes only.