



Pi Network price has fallen toward $0.087 after retreating from last week’s highs, leaving buyers defending rising daily support while a bullish analyst forecast hinges on a break above $0.11.
Summary
- Pi Network price traded near $0.087 after retreating from its seven-day high around $0.0935.
- Daily price remained below the 20-, 50-, 100-, and 200-day simple moving averages.
- Protocol 28 has an Oct. 13 node deadline and an Oct. 16 mainnet target.
- Gopal’s bullish setup requires a daily breakout above the $0.105–$0.11 neckline.
CoinGecko recorded PI at $0.08719 on Oct. 6, down 4.3% over its rolling seven-day window, despite a small daily gain. Its weekly range stretched from $0.08611 to $0.09345, placing the token close to the bottom of that band.
On OKX’s daily PI/USDT chart, price stood at $0.08722, while the 4-hour chart showed $0.08741. Both readings put PI below $0.09, a level the shorter timeframe repeatedly crossed during late September before sellers pushed the token lower again.
The latest decline followed several failed recovery attempts. On the 4-hour chart, PI approached $0.092–$0.094 around Sep. 23, Sep. 27, and Oct. 1, but each advance reversed before price could build a lasting position above that area.
Thin trading accompanies Pi Network’s weekly decline
CoinGecko’s snapshot put daily trading volume at about $3.24 million, against a market value near $980 million. The provider also recorded a roughly 34% decline in daily trading activity, alongside PI’s underperformance against a broader crypto market that gained 2.7% over seven days.
Taken together, the price and turnover readings show PI losing ground without a sustained increase in trading participation. Falling volume does not identify who sold, but it gives little support to a claim that buyers have already returned in force.
Supply remains part of the project’s broader market backdrop. Pi Network’s white paper describes a system in which user balances move to mainnet and voluntary lockups can keep migrated tokens unavailable for a chosen period.
Tokens becoming transferable can increase the amount available to trade. An unlock alone, however, does not establish how much will reach exchanges or how much holders will sell.
The recent daily chart offers a more direct explanation of the weak price structure: PI has struggled to stay above its shorter moving averages, and rebounds have continued to encounter overhead resistance. The weekly decline extends that pattern rather than marking a confirmed reversal of the longer downtrend.
Pi Network has also scheduled a network upgrade during the same period. The team announced that node operators must update to Protocol 28 by Oct. 13, ahead of a planned mainnet upgrade on Oct. 16.
According to the announcement, Protocol 28 improves the handling of transaction-data delays and lets developers upgrade groups of smart contracts and change stored data more safely. Those are network changes; the announcement makes no price forecast.
PI’s position below $0.09 shows that the approaching upgrade has yet to coincide with a sustained recovery above nearby chart resistance. A successful rollout and a confirmed price breakout remain separate milestones.
Daily resistance starts below $0.092
TradingView’s daily OKX chart places the 20-day simple moving average at $0.08827 and the 50-day average at $0.09096. The 100-day average sits slightly higher at $0.09159, creating a sequence of nearby barriers above the latest price.
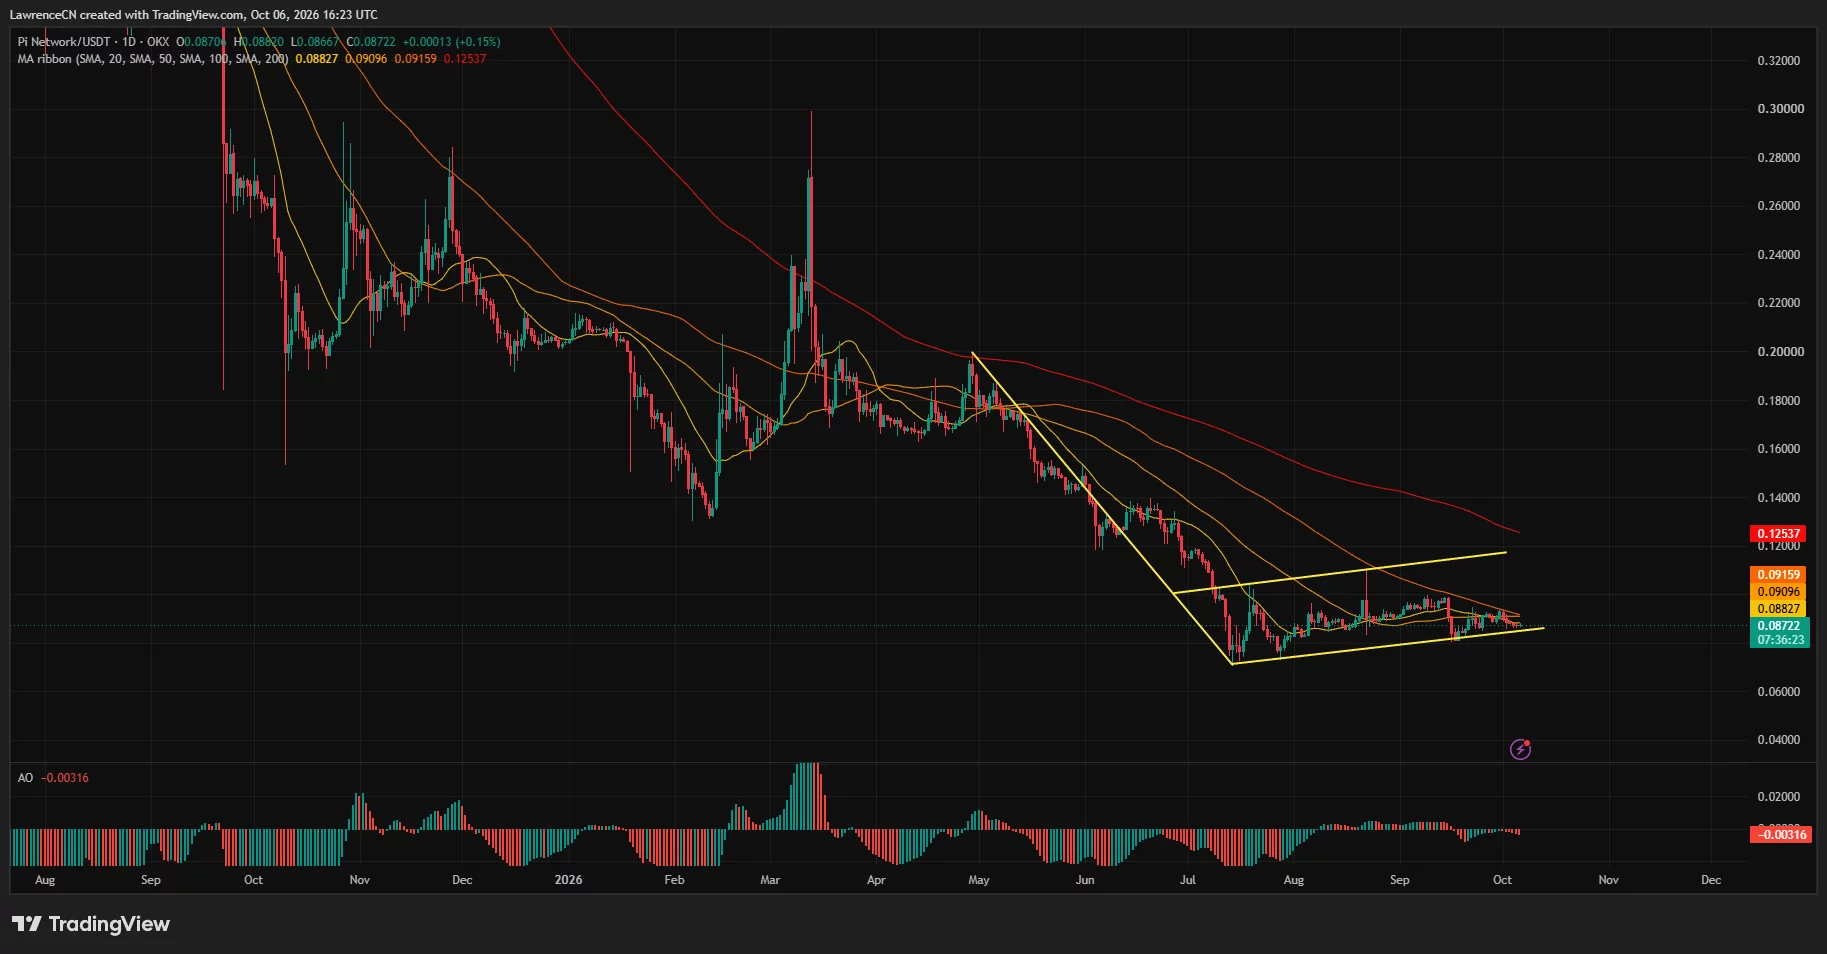
The first recovery test is therefore around $0.0883. A move through that level would bring the $0.091–$0.092 region into focus, where the 50- and 100-day averages overlap with resistance visible on the shorter timeframe.
The averages are also ordered bearishly: the 20-day sits below the 50-day, which remains below the 100-day. PI would need to recover through several separate levels before the daily chart showed a greater change in direction.
Farther overhead, the 200-day average stands at $0.12537. Its downward slope and distance above price show how much ground the token must regain to challenge the longer-term trend.
The yellow trend lines outline a rising channel following the sharp decline into July. PI is now trading close to its lower boundary around $0.086–$0.087, while the upper boundary extends toward roughly $0.115–$0.12.
A daily break beneath the lower boundary would weaken the channel’s sequence of rising lows. Holding the line would preserve that structure, although PI would still face the moving-average cluster before reaching the channel’s upper edge.
Momentum has not confirmed a bullish recovery. The daily Awesome Oscillator reads -0.00316, with its latest bars below zero, indicating that shorter-term average price momentum remains weaker than the longer comparison period used by the indicator.
The combined daily picture is mixed but tilted lower: rising channel support remains nearby, while price sits below every displayed moving average and the oscillator remains negative.
The 4-hour chart puts $0.08545 beneath near-term support
On the 4-hour chart, three rounded recovery attempts end around the same overhead region. The latest rejection near $0.093 sent PI back toward $0.087, leaving the token below the prior rebound peaks.
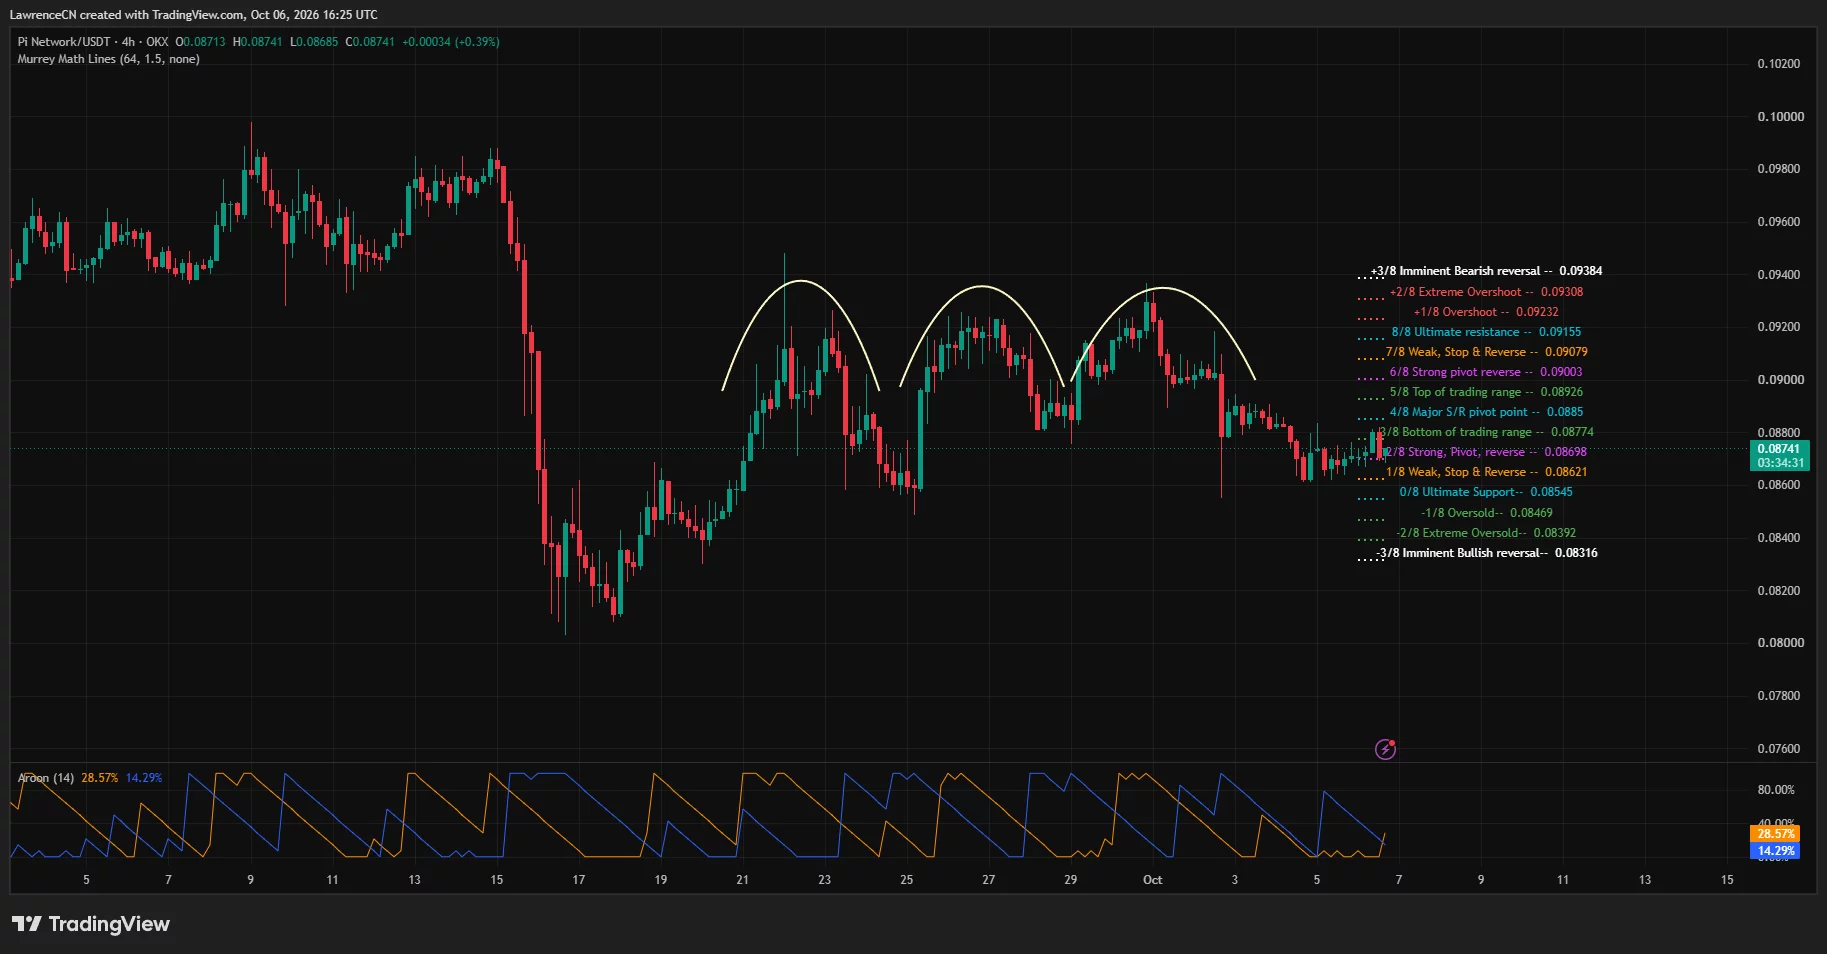
The Murrey Math overlay marks $0.08698 as a nearby pivot and $0.08621 as the next lower level. Beneath those, $0.08545 is the overlay’s base support, followed by $0.08469, $0.08392, and $0.08316.
A sustained break below $0.08545 would leave the September trough around $0.081–$0.082 as a deeper reference on the visible chart. That would also move price away from the daily channel support currently under test.
For a rebound, the first levels above price are $0.08774 and the central pivot at $0.0885. The next resistance steps sit at $0.08926, $0.09003 and $0.09079, before the upper range level at $0.09155.
Recovering $0.0885 would improve PI’s immediate position within the overlay. Clearing $0.09155 would be a stronger test because it would also take price toward the daily 50- and 100-day moving averages.
The Aroon panel shows readings of 28.57% and 14.29%, with both lines low on their scale. Neither is close to the upper end associated with a recent, persistent run of new highs or lows, leaving the small rebound without a strong trend signal from that indicator.
Gopal’s $0.14 target requires a neckline breakout
In an Oct. 5 post, analyst Gopal identified a potential double-bottom structure on PI’s daily chart, with price around $0.0868.
His setup places the neckline at $0.105–$0.11 and the first upside target near $0.14. He also outlined a higher target of $0.21–$0.22, conditional on the bullish structure developing.
The analyst said a confirmed daily breakout above the neckline would strengthen the setup and could open the way toward $0.14. His support zone sits at $0.075–$0.08; losing it would weaken the bullish case.
Measured from roughly $0.087, the neckline requires a gain of about 21%–26%, while $0.14 would represent approximately 61% upside. The forecast therefore depends on PI clearing resistance well above its current range.
The nearer chart tests come first: $0.0883, the $0.091–$0.092 moving-average cluster, and the recent rebound peaks around $0.093. Until those levels give way, the daily chart remains some distance from confirming Gopal’s larger reversal.
For U.S. investors assessing the dollar-denominated outlook, the distinction is between a recovery toward local resistance and an analyst’s conditional longer move. The immediate chart hinges on support around $0.085–$0.087; Gopal’s bullish forecast hinges on a daily breakout above $0.105–$0.11.
Disclosure: This article does not represent investment advice. The content and materials featured on this page are for educational purposes only.